
Learn everything about construction reporting from basics to best practices, including software tools, templates, and tips to make better project reports faster.

Download the FREE Project Report Template in a ready-to-use Microsoft Word format.

Should we assume that a huge part of your construction project reporting involves endless spreadsheets and manual work? Probably.
Reporting in construction is the backbone of any successful capital project. It helps stakeholders stay informed about progress, performance metrics, and critical project outcomes through comprehensive reports.
The reality? Most construction teams are still stuck in the past. Construction reporting remains heavily dependent on siloed PDF documents and countless spreadsheets, often 'hacked' together to create something that resembles a proper report.
Here's the shocking truth:
This comprehensive guide will walk you through everything you need to know about modern construction reporting - from fundamental practices to advanced solutions that can transform your reporting workflow.

Construction reporting is the process of collecting, analyzing, and sharing information about a project's status, progress, performance, and scope. This essential project progress report system covers everything from planning and design to on-site construction activities.
What makes it crucial? It happens at every level of project management: projects, programs, and portfolios.

Using effective construction reports helps managers and stakeholders:
.png)
Traditionally, construction project reporting meant manually gathering data from multiple sources like:
But with modern technology, the reporting process has changed a lot and for the better!!! 😀
Now, we have advanced digital tools and project reporting software like Mastt that make the process easier and more efficient. These technological innovations have shifted project reporting from:
Manual & periodic task ➡️ Dynamic & continuous process
Self-service reporting now allows stakeholders to access real-time data, customize reports, and collaborate seamlessly across various levels of capital projects, programs, and portfolios.
In the construction industry, reporting is organized at different levels. Information flows from the construction site up to key decision makers in the overall capital project, program, or portfolio.
Each level serves distinct purposes within a project owner. It caters to different stakeholders, ensuring the right information reaches the right people at the right time.

At the construction site level, progress reports come from subcontractors and general contractors. They focus on the day-to-day activities of on-site construction.
This information is then used to compile construction status reports detailing progress, materials, schedules, budgets, risks, and issues, providing a thorough overview for the client or capital project manager.
The project level focuses on monthly report creation and review. Project managers collect reports from the general contractor. They present clear project status updates to the Project Owner.
These combined reports cover progress, risk management, and performance metrics. Everything helps in making decisions and planning ahead. Project managers monitor all aspects closely. They ensure progress from start to finish.
Program managers handle multiple capital projects. They need aggregated RAG Status data for program-wide insights. Their reports consolidate information from all projects. This gives a macro-level view of performance, risks, and phases.
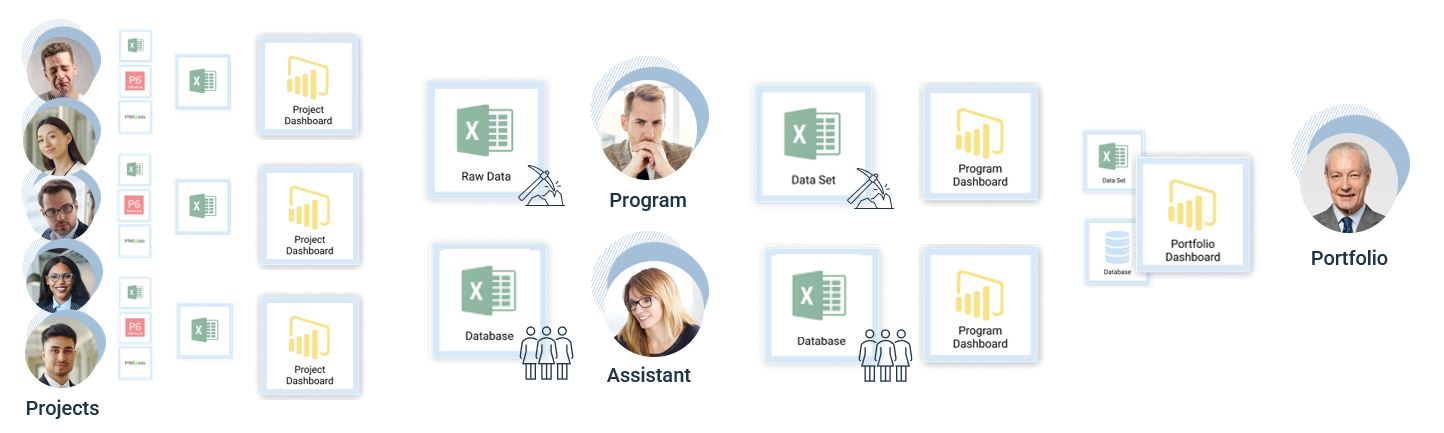
At the portfolio level, executives need the full picture. They use Project Management Dashboards to track everything. These show portfolio performance, project pipeline, and strategic alignment.
Project owners monitor how all projects are being done. They check current stages and status. Are budgets being followed? Are schedules on track? Do projects align with strategic goals? These insights drive decisions. They ensure strategy alignment. They help program and project managers succeed.
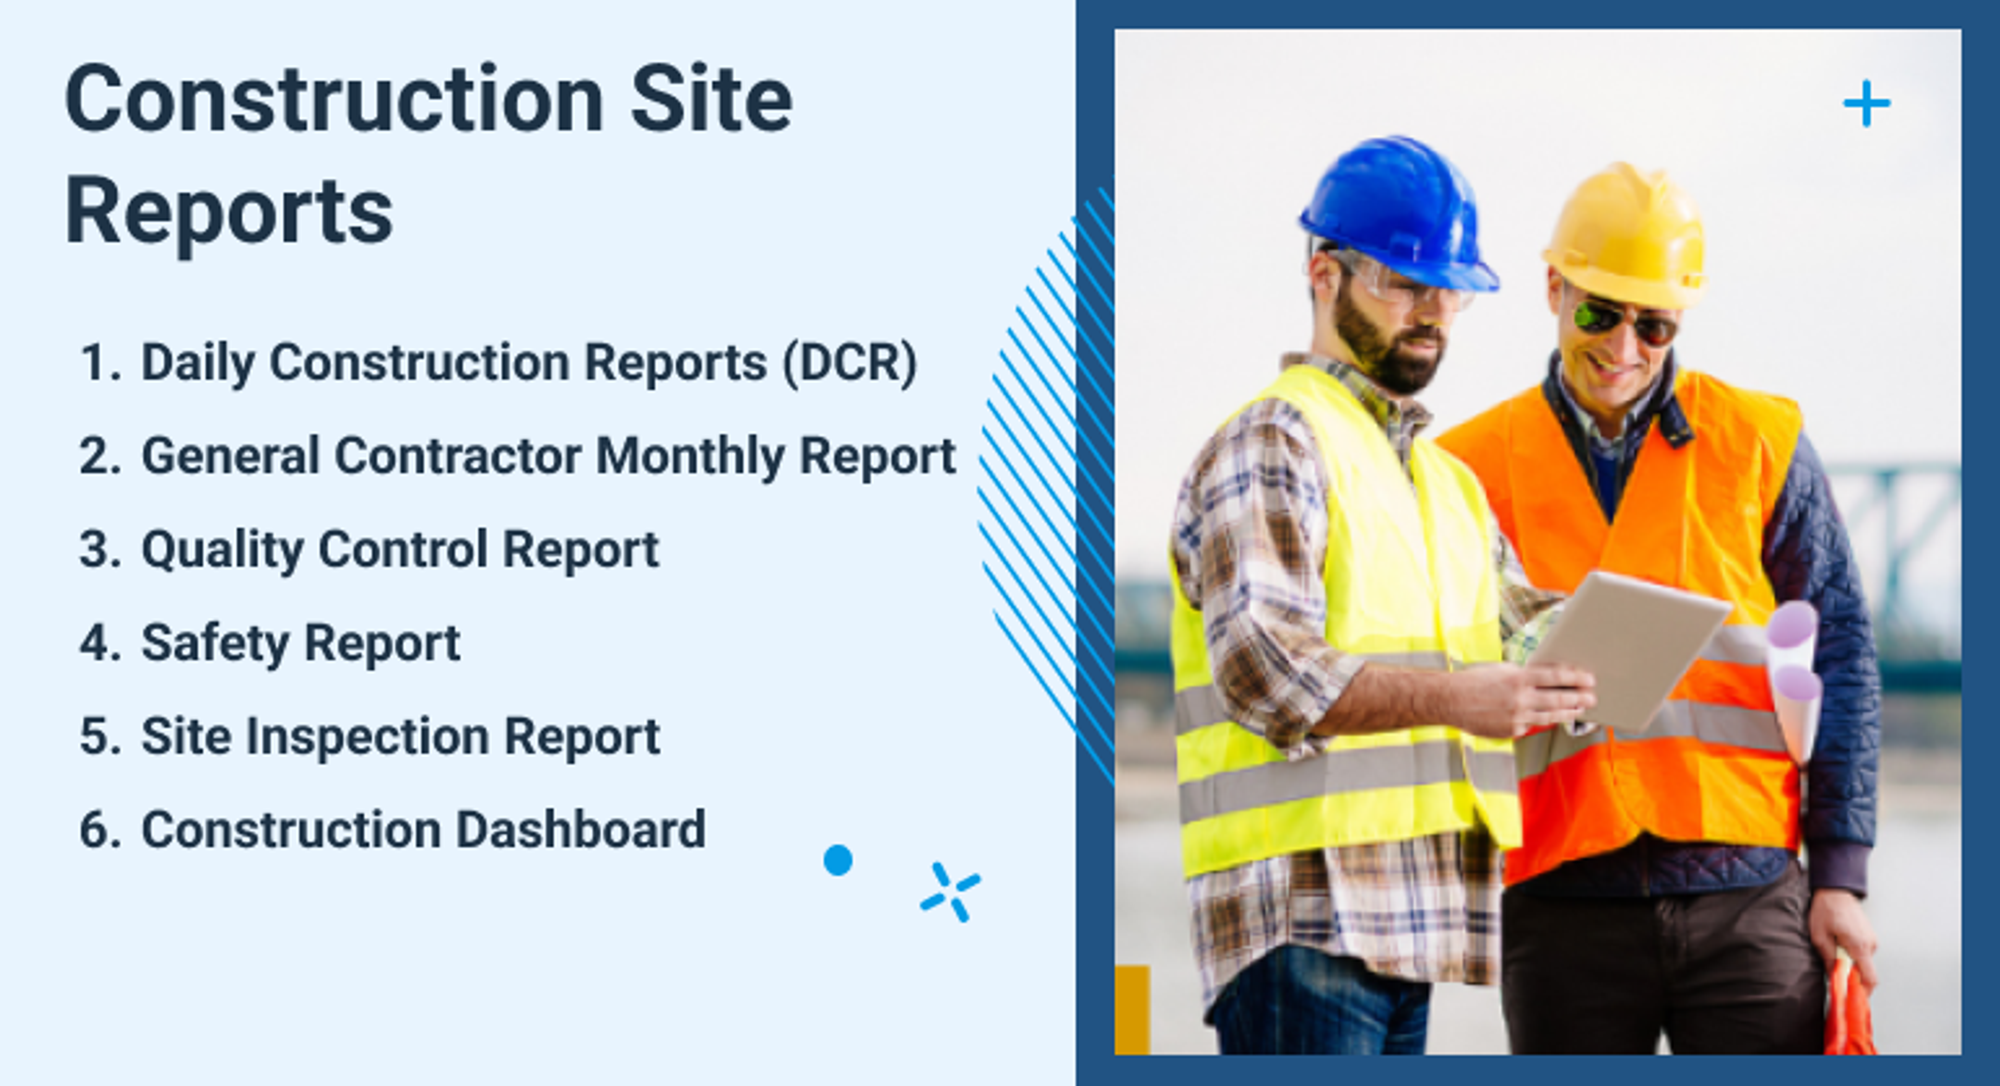
Construction project reports vary by management level and purpose, each serving specific stakeholder needs. From daily site updates to executive portfolio insights, these reports create a complete picture of project performance and progress.
Construction site reporting captures the day-to-day reality of your project execution. These reports document everything happening on the ground, from worker activities to safety incidents, ensuring nothing gets missed in your daily operations.
These monthly report template word types essential for site management include:
Capital project management requires comprehensive reporting that tracks every aspect of your project lifecycle. These reports provide the insights needed for informed decision-making, from initial planning through to completion.
.png)
Program management demands reports that can aggregate and analyze data across multiple projects. The right report template word helps you spot trends, manage resources effectively, and ensure all projects align with program objectives.

Executive reporting focuses on strategic insights and high-level decision support. Using a comprehensive client reporting dashboard provides the big-picture view needed for portfolio optimization and strategic alignment, helping executives manage their entire project investment effectively.

A construction progress report needs essential elements that monitor progress, manage risks, and communicate clearly with stakeholders. Here's a complete breakdown of these key components.
Your report needs a strong foundation with clear project identification and context. A well-structured report template word starts with the basics.
Title and Description should clearly state your project or program's name and purpose, giving readers immediate context about what they're reviewing. This sets the stage for all subsequent information.
The Reporting Period documents your specific timeframe, while a consistent Project Image serves as a visual anchor throughout all reports. Location details help stakeholders understand the geographical context, especially crucial for multi-site portfolios.
Your Stakeholder section lists all key players, from clients to consultants, creating clear accountability. The Description provides a brief yet comprehensive project overview, including scope boundaries and objectives.
The construction dashboard begins with a Progress Summary. This concise overview presents key achievements, significant issues, and critical decisions needed. Think of it as the "if they read nothing else" section of your report.
RAG Status translates complex performance indicators into simple red, amber, or green indicators. This covers essential metrics like scope, cost, time, and risk, making it easy for stakeholders to quickly gauge project health.
.png)
Visual documentation through site photos and progress markers helps stakeholders understand actual construction progress. The Current Status describes completion percentages and ongoing work, while Milestones Achieved celebrates key accomplishments and maintains team momentum.
.png)
Safety performance stands as a crucial indicator of project health. A construction KPI dashboard for safety should detail all critical metrics.
The lost time injuries (LTI) and total recordable incident rate (TRIR) form your primary safety indicators, backed by data on hours worked without incidents and completed safety training sessions.
Compliance monitoring requires careful attention to local, state, and federal regulations. Each safety incident needs thorough documentation, including immediate responses and preventive measures taken.
To spot trends early, include a Safety Incident Rate Line Graph that visualizes incident frequency over time – this helps teams identify problem areas before they escalate.
Project timelines require both visual and detailed written tracking for maximum clarity. Start with an overview that maps out your project timeline, marking both completed milestones and upcoming targets.
Document any project delays or timeline extensions clearly, explaining both cause and impact. Your upcoming milestones section should highlight the next critical targets, helping teams maintain focus. Include a Gantt chart in the appendix for a comprehensive view of the timeline, supported by a Project Milestone Chart that shows progress against key deliverables.

Financial tracking requires careful attention to both current spending and future projections. The monthly progress report should present a clear budget overview with detailed breakdowns of all cost categories.
Track actual costs against the budget continuously, highlighting any variances that need attention. Your financial forecast needs to look ahead, using metrics like Forecasted Final Cost (FFC), Estimate to Complete (ETC), and Estimate at Completion (EAC) to give stakeholders a clear picture of where the project is heading financially.

Project cost forecasting combines several key tools for accurate prediction. The construction S curve projects future spending patterns, helping teams anticipate and manage budget constraints throughout the project lifecycle.
Use the project dashboard template to track Earned Value Management (EVM) metrics, including Earned Value (EV) and Planned Value (PV). Support these metrics with visual comparisons of planned versus actual costs to quickly identify any overruns or savings.

Risk management demands a proactive approach. Create a comprehensive risk assessment using the project status dashboard to map both threats and opportunities. Each identified risk needs clear mitigation strategies and regular status updates.
The Risk Assessment Matrix helps prioritize risks based on likelihood and impact. Keep the detailed risk register in the appendix, but highlight key risks and mitigation progress in the main report. Don't forget to identify potential opportunities that could benefit the project.

When applicable, track design progress carefully. Document all design changes and their impacts on scope, timeline, and budget. Ensure continuous compliance with building codes and standards, maintaining clear records of all design decisions and their justifications.
Detail all construction activities during the reporting period, focusing on significant progress and milestones. Monitor general contractor performance closely, documenting any issues encountered and resolutions implemented. This creates a clear record of site progress and contractor accountability.
Quality control forms the backbone of successful project delivery. The monthly report should clearly outline required standards and specifications, from material requirements to installation procedures.
Track all quality control measures implemented, including inspections, testing protocols, and verification processes. Each measure needs documentation of its effectiveness in maintaining project standards and addressing any quality issues that arise.
Effective communication drives project success. Your progress reports should capture all key stakeholder interactions, from formal meetings to informal feedback sessions. Document main discussion points, critical decisions, and assigned action items that keep the project moving forward.
Record stakeholder feedback systematically, showing how concerns are addressed and resolved. Highlight coordination efforts between different stakeholder groups – this demonstrates proactive management and helps prevent potential conflicts.
Every project faces challenges. Using a project tracker helps document both obstacles and their resolutions clearly. Describe challenges encountered during the reporting period, whether they're technical, logistical, or resource-related.
For each challenge, detail the solutions implemented and their effectiveness. This creates a valuable record for future reference and demonstrates the project team's problem-solving capabilities to stakeholders.
A thorough project status report template starts with a detailed Table of Contents, making navigation intuitive for readers. This helps stakeholders quickly find specific information in lengthy reports.
Version control through a RAG status template becomes crucial for tracking document history. Each revision needs clear documentation of what changed, when, and why – creating an audit trail of report modifications.
Your appendices should include comprehensive backup documentation. A construction KPI dashboard in the appendix can showcase detailed metrics, while Gantt charts provide visual timelines of project tasks, durations, and dependencies.
Include supporting materials like:
Each appendix item should supplement main report content without cluttering the primary narrative.
Use dashboards for quick, visual updates and real-time monitoring, while traditional reports work better for detailed analysis and comprehensive project documentation. Many successful projects actually combine both formats, using dashboards for daily tracking and detailed reports for periodic reviews.
Each type has its own pros and cons, and understanding these will help customize the report to its intended audience and purpose. Let’s dive in.
.png)
When choosing between a dashboard or a report, and whether it will be digital or printed, consider:
Here’s our recommendations on which type to use based on who your construction project report is serving:
Here’s a table comparing Hard Copy vs. Digital Format reports:
Regardless of format, every construction report must have key features that ensure its effectiveness and utility. The most successful reports combine accessibility, accuracy, and security while supporting quick decision-making.
Every construction progress report needs five essential qualities:
Setting up construction project reporting requires establishing basic controls and templates first. This systematic approach saves time and ensures reporting success by creating a foundation for consistent, efficient project tracking and communication.
Start with a solid foundation. The plan on a page outlines your scope, objectives, and timeline clearly. This initial planning makes it easy to compare actual progress with original goals when reporting.
Why it helps: You can't track progress effectively without first knowing what you're measuring against.
Implement standardized report template word formats for consistent reporting. A good template includes sections for project status, costs, risks, and milestones - all structured for quick updates.
Why it helps: Templates ensure consistency across reports and speed up the reporting process dramatically. Your progress report template becomes a reliable framework for all future reporting needs.

Effective cost control starts with proper tracking tools. The construction KPI dashboard helps manage commitments and expenses in real-time. Regular forecast updates ensure your financial picture stays accurate.
Why it helps: You'll generate quick, accurate financial reports that clearly show budget performance.
Breaking down your project requires clear milestones. The project status dashboard keeps your schedule visible and updated. Each milestone needs specific deadlines and clear ownership.
Why it helps: You can easily report on project progress and deadline adherence.
Start with a comprehensive ISD bond program report approach to risk tracking. Assess each risk's impact and develop clear management plans. Update your risk register regularly to reflect changing conditions.
Why it helps: Your reports will show both current risks and mitigation strategies, keeping stakeholders confident in your risk management approach.

Establish clear change control processes using a project portfolio dashboard to track scope, budget, and timeline modifications. This system ensures everyone follows the same approval and documentation procedures.
Why it helps: Your reports will always show current, approved project status with a clear trail of changes.
Move beyond manual templates with modern monthly progress report solutions that automate data compilation. These tools transform scattered information into cohesive, professional reports automatically.
Why it helps: Besides being awesome, reporting software saves hours of work while reducing human error. Your reports become more consistent, accurate, and readily available.

Project Reporting Operations (PRO) breaks down the reporting process into five manageable steps: Capture, Compile, Circulate, Consume, and Continuous Improvement. This systematic approach ensures thorough, effective project reporting.

The first step, data capture, involves collecting and documenting project information throughout the reporting period. The project portfolio dashboard starts with gathering vital updates on:
Collection Process: Your monthly report template word needs data from multiple sources:
Documentation Methods: Using a project tracker helps standardize how you record this information. Most teams still rely on spreadsheets and manual documentation - you're not alone in this approach.
.png)
After capturing data, compilation transforms raw information into meaningful insights. The project report format traditionally takes 4-8 hours per report due to double handling of information.
Preparation Process: Start with a project status dashboard to organize your data effectively. Your report needs clear narratives that explain the data's significance and implications for the project.
Visual Elements: Transform complex data into clear visuals using a PCG report structure. Charts, graphs, and tables help stakeholders quickly grasp:
Remember, a well-compiled report should both look professional and answer key stakeholder questions effectively.

The circulation phase ensures your compiled report reaches all stakeholders efficiently. A client reporting dashboard makes sharing easier than traditional PDF distribution.
For distribution strategy, create a comprehensive project on a page recipient list. Your stakeholder groups should include:
For sharing best practices, using construction reports in digital format streamlines distribution through:
As always, confirm that your stakeholders can easily access and view the reports in their preferred format.

Your project status report isn't meant to gather dust. Instead, bring it to life in your monthly meetings. Actually, you can ditch those extra PowerPoints - just use the report itself to guide discussions and spark action.
Here's the real power: when stakeholders dig into your monthly report, good decisions follow naturally. They'll quickly spot where budgets need tweaking, when timelines should shift, and which risks need attention right away. After all, solid data makes for confident choices.
Of course, your level-up reporting shouldn't stay frozen in time. Think of it as a work in progress.
Pay attention to what your stakeholders tell you - they'll help you make clearer reports, show data better, and share insights faster.
The best part? Every lesson learned makes the next report better. Maybe you'll find a faster way to gather data or discover an easier report format.
Perhaps your team needs different training. Whatever it is, these small wins add up to smoother projects down the road.
.png)
Looking ahead, the future of construction project reporting is set to be transformed by self-service and continuous reporting platforms.
These advanced systems will automate many manual tasks, provide real-time data and interactive dashboards, and enable seamless collaboration among stakeholders.
Here’s how we see the transformation occurring with the introduction of project reporting platforms.
While good reporting drives project success, poor reporting practices can derail even the most promising projects. Let's look at the real challenges construction teams face and why they matter.

The good news is that these construction project reporting problems have solutions. Let's explore what makes construction reporting complex and how to handle these challenges better.
First off, there's reporting overload. Your client reporting dashboard might be drowning in stakeholder requests. Everyone wants their own report, tailored their way. No wonder consistency suffers.
Then there's the organizational maze. Unclear roles lead to messy data. People tend to report what makes them look good, not what's actually happening. Your monthly progress report needs truth, not spin.
Corporate demands don't help, either. When reporting feels like a box-ticking exercise, data gets twisted to fit financial stories. Add strict contract requirements, and reporting becomes rigid - exactly what construction projects don't need.
People bring their own complications. Fear of bad news leads to sugar-coating. Management pressure skews the truth. Using a structured project tracker helps keep everyone honest.
Technology should help, but it often hurts instead. Multiple construction management software systems create double work. Communication gets tangled. Data accuracy suffers. Timely collection becomes a constant struggle.
The key? Getting accurate, timely data that serves project needs, not just corporate demands. When information flows freely and honestly, projects run smoother.
After analyzing thousands of projects, we've identified key practices that maximize reporting efficiency while delivering real value. Here's how to transform your reporting process.
Start with a solid foundation. Your project report template needs a clear structure and ownership. Think of it as setting up a reporting factory - once it's running smoothly, everything flows better.
First, document your process using the 5 Critical Steps method. The dashboard checklist should clearly show:
Set up regular rhythms for your reporting cycle. Using a dashboard vs report approach helps establish:
Yes, setting this up takes time. But the payoff is massive time savings down the road and more reliable reports for everyone involved.
.png)
Time to upgrade! Replace old-school reports with modern solutions. Mastt’s Project Status Dashboard offers real-time, interactive views of your project data. This helps stakeholders grasp information quickly and make faster decisions.
Smart scheduling makes reporting manageable. The construction project report schedule needs careful planning. Monthly reports give you 12 check-ins per year! Want more decision-making power? Try bi-weekly updates.
Pro tip: Your project dashboard template should be ready before key meetings. Time your reports strategically - have fresh data available when decisions need making. No more rushing to update old information!
Think about it: Every report is a chance to guide project success. More frequent updates mean more opportunities to spot and solve issues early.
.png)
Know what matters to your audience. The Project Management Dashboards should drive real decisions, not satisfy bureaucracy.
Regular chats with stakeholders reveal what information they actually use. This helps you cut the fluff and focus on insights that matter.
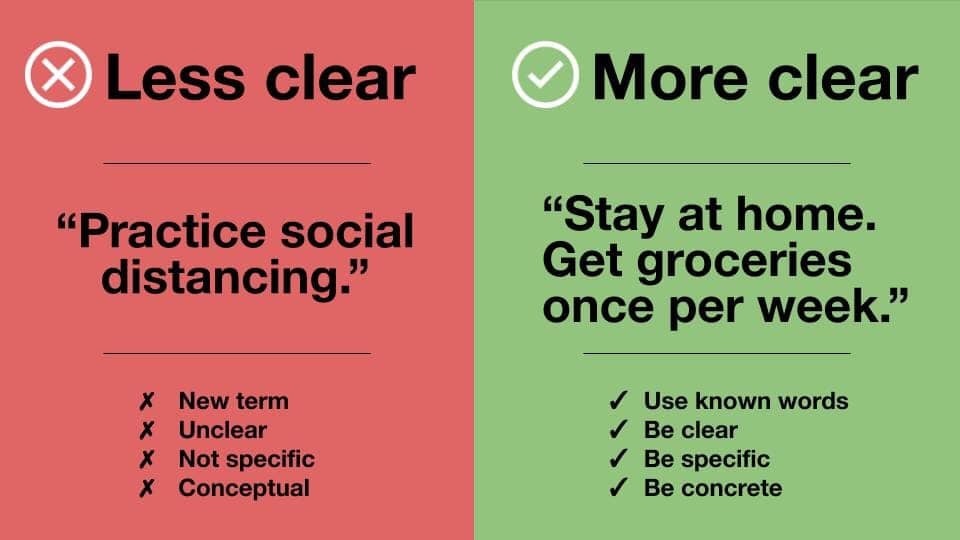
Ditch the complex jargon. Your project status report needs to speak clearly to everyone involved.
When a site manager and CEO can understand the same report, you're doing it right. During the pandemic, we learned this lesson well - clear communication saves time and prevents mistakes.
With attention spans of just 8 seconds, you can't bury the lead. The construction project report must front-load critical information. Start with:
Structure your report like a newspaper - big headlines first, details later. Put your decision-making information at the top, keeping record-keeping data in the back. This way, busy executives get what they need in those crucial first seconds.
Transform dense data into clear visuals. A well-designed chart can:
Remember that a five-minute chart review often beats an hour of reading text. Choose visuals that make your key points jump off the page.

Your Project Report Format should balance accessibility with depth. Keep the main report clean but include all supporting data in drill-downs or appendices.
Essential details like timeline breakdowns, budget analysis, progress metrics, and risk assessments stay available without cluttering the main view.
This layered approach helps readers focus on key points while having full access to deeper information when needed.

Data quality can make or break decisions. Your construction project report needs rigorous checking processes, but avoid creating a culture of fear.
When team members worry about punishment for mistakes, they hide problems instead of reporting them. Build an environment where accuracy is rewarded, and early problem identification is valued.
Modern reporting demands modern solutions. The project dashboard should eliminate data silos and duplicate entries.
Stop moving data between incompatible systems - it's slow and error-prone. Instead, look for integrated platforms that connect your data sources directly. This saves time while reducing mistakes and inconsistencies across reports.

Strong data management reveals project trends and patterns over time. Create a central repository where all reporting data lives - from project management metrics to financial figures and field updates.
Combine automated collection with manual verification to ensure both efficiency and accuracy. This dual approach catches errors early while maintaining the speed of automated systems.
.png)
Eventually, every construction project needs to streamline its reporting operations. The good news? The industry is rapidly moving toward digital platforms that make reporting faster, easier, and more accurate.
These platforms, like Mastt, offer numerous benefits, including automated data capture, real-time reporting, and easy reporting sharing.
Here’s a detailed look at Mastt’s vision for implementing a global project reporting platform:
Let's talk about making construction project reporting painless. The Project Report Format becomes a breeze with automated tools. Gone are the days of slow, mistake-filled manual entry.
Here's what Mastt's platform brings to the table:
Pretty neat, right? No more double-handling data or wondering if your numbers are current. The system keeps everything up-to-date while you focus on what matters.
Here's something interesting about your project portfolio dashboard - it's actually way more than just a reporting tool. Think of it as your project's brain, storing and organizing everything in one place.
Want to see what makes it special? Here's what it can do:
The best part is that your construction reports become a goldmine of insights. Compare how things are going across different timeframes, spot trends before they become obvious, and let AI help predict what's coming next.

Think about all the time you spend creating reports manually. Well, here's some good news: the report template word gets supercharged with automation. Just set it up once and let the system do the heavy lifting.
What makes this really powerful? Your dashboards:
And here's the best part - your status report template becomes a living document. No more late nights preparing reports. The system handles updates and delivery automatically.

Say goodbye to those clunky PDF emails! The construction project tracking becomes a breeze with modern sharing features. Think of it as your project's own website - always on, always current.
Everyone gets what they need:
With this feature, your whole team works with the same current data. No more version confusion or outdated information floating around. Just clear, accessible insights when you need them.

Real-time monitoring changes everything about project management. The dashboard checklist puts your project's vital signs right at your fingertips - no more waiting for updates or chasing information.
Here's what real-time visibility from Mastt brings to your team:
This immediate insight lets project managers spot trends and tackle issues right away. Instead of dealing with week-old problems, you're preventing them before they hit your schedule or budget. It's a game-changer for project control.
The construction dashboard does something powerful - it creates one version of the truth. No more debates about whose numbers are right or which report is current.
Your team gets these powerful tools:
Just look at Proven PM's results - better client satisfaction, lower risk, and more repeat business. That's what happens when everyone works with the same reliable information.
Let's look at the numbers. The RAG Status shows something interesting: a typical 10-project program spends $270,000 yearly on reporting. With automation, you could save $157,500 of that.
Where do these savings come from?
Plus, you're helping the environment:
Better insights, happier clients, lower costs, and environmental benefits - that's what Mastt’s modern reporting delivers.

While many construction project management tools include reporting features, only a select few truly specialize in construction reporting. Let's examine your top options for getting those reports right.
The Project Report Format transforms completely with Mastt's specialized platform. Built specifically for construction and capital projects, it understands the unique challenges of project reporting in the industry.
Key Features:
The platform cuts reporting time in half through its construction kpi automation. Instead of juggling multiple spreadsheets, you get a single source of truth where all your project controls connect seamlessly.
Benefits:
The free tier lets you test-drive everything with one project. The modern interface makes adoption painless, though you'll need to upgrade for multiple projects. Even new users find they can start creating professional reports within hours.

Microsoft's Power BI brings serious analytical muscle to construction reporting. The project dashboard template options offer deep customization for construction data visualization.
Key Features:
Benefits:
The main challenge? Setup requires significant technical knowledge, especially for construction-specific needs. But once configured, it offers robust analytical capabilities that help identify project trends and potential issues early.
Tableau specializes in making complex construction data instantly understandable. It excels at creating clear, interactive visualizations that help teams grasp project status at a glance.
Key Features:
Benefits:
While powerful, Tableau is expensive for what it offers. Beyond the base license, you'll likely need additional connectors and server options for full functionality in a construction environment.
While Excel remains common in construction, it's increasingly showing its age. The project report template options are extensive, and when paired with Power Query and Power Pivot, you can create detailed custom reports.
Key Features:
Benefits:
Unfortunately, Excel's limitations have become clearer in today's construction projects. Manual data entry leads to frequent errors, collaboration is cumbersome, and real-time reporting remains a challenge. Modern construction projects simply demand more sophisticated solutions.
Smartsheet improves on the spreadsheet model but still falls short of specialized platforms. The project tracking capabilities combine spreadsheet familiarity with basic collaboration features.
Key Features:
Benefits:
While it handles simple reporting better than Excel, Smartsheet struggles with the complexities of large construction projects. Consider it a middle ground between basic tools and comprehensive construction platforms like Mastt.
For presenting your monthly progress report, PowerPoint serves its purpose - but that's about it. It's a presentation tool, not a reporting solution.
Key Features:
Benefits:
The limitations are significant: no real-time data, no interactive features, and no automated updates. Today's construction projects need dynamic, real-time reporting platforms that can handle the complexity and pace of modern construction.
Let's talk about what really matters when picking your reporting tool. After all, the right choice can transform your reporting from a headache into a breeze.
Speaking of which - this is where platforms like Mastt really shine. Mastt is built from the ground up for construction by people who get what you need. No forcing square pegs into round holes - just reporting that works the way construction actually does.
Construction reporting isn't going anywhere, and it's becoming more crucial than ever. As projects grow more complex and stakeholders demand better insights, the way we report will keep evolving.
The good news? The tools and practices are getting better too. Modern platforms are making it easier to create timely, accurate, and truly insightful reports. This means better decisions, smoother projects, and ultimately, a better built environment for everyone.
Ready to transform your construction project reporting? The tools are here, the benefits are clear, and the time to upgrade is now!
Save time, speed up reporting with the best automated tools
Get StartedSlash your reporting costs by more than 50%
.avif)


.avif)

.avif)


