


A construction progress report gives you a clear, real-time snapshot of where your project stands. It highlights completed work, identifies roadblocks, and keeps everyone on the same page. Done right, it streamlines decision-making and prevents small issues from turning into major setbacks.
But how do you track progress? How do you communicate it?
This guide breaks down what makes a great progress report in construction, how to structure it for maximum impact, and templates to help you create one fast. Whether you're managing one project or an entire portfolio, these insights will help you improve your construction reporting.
What is a Construction Progress Report?
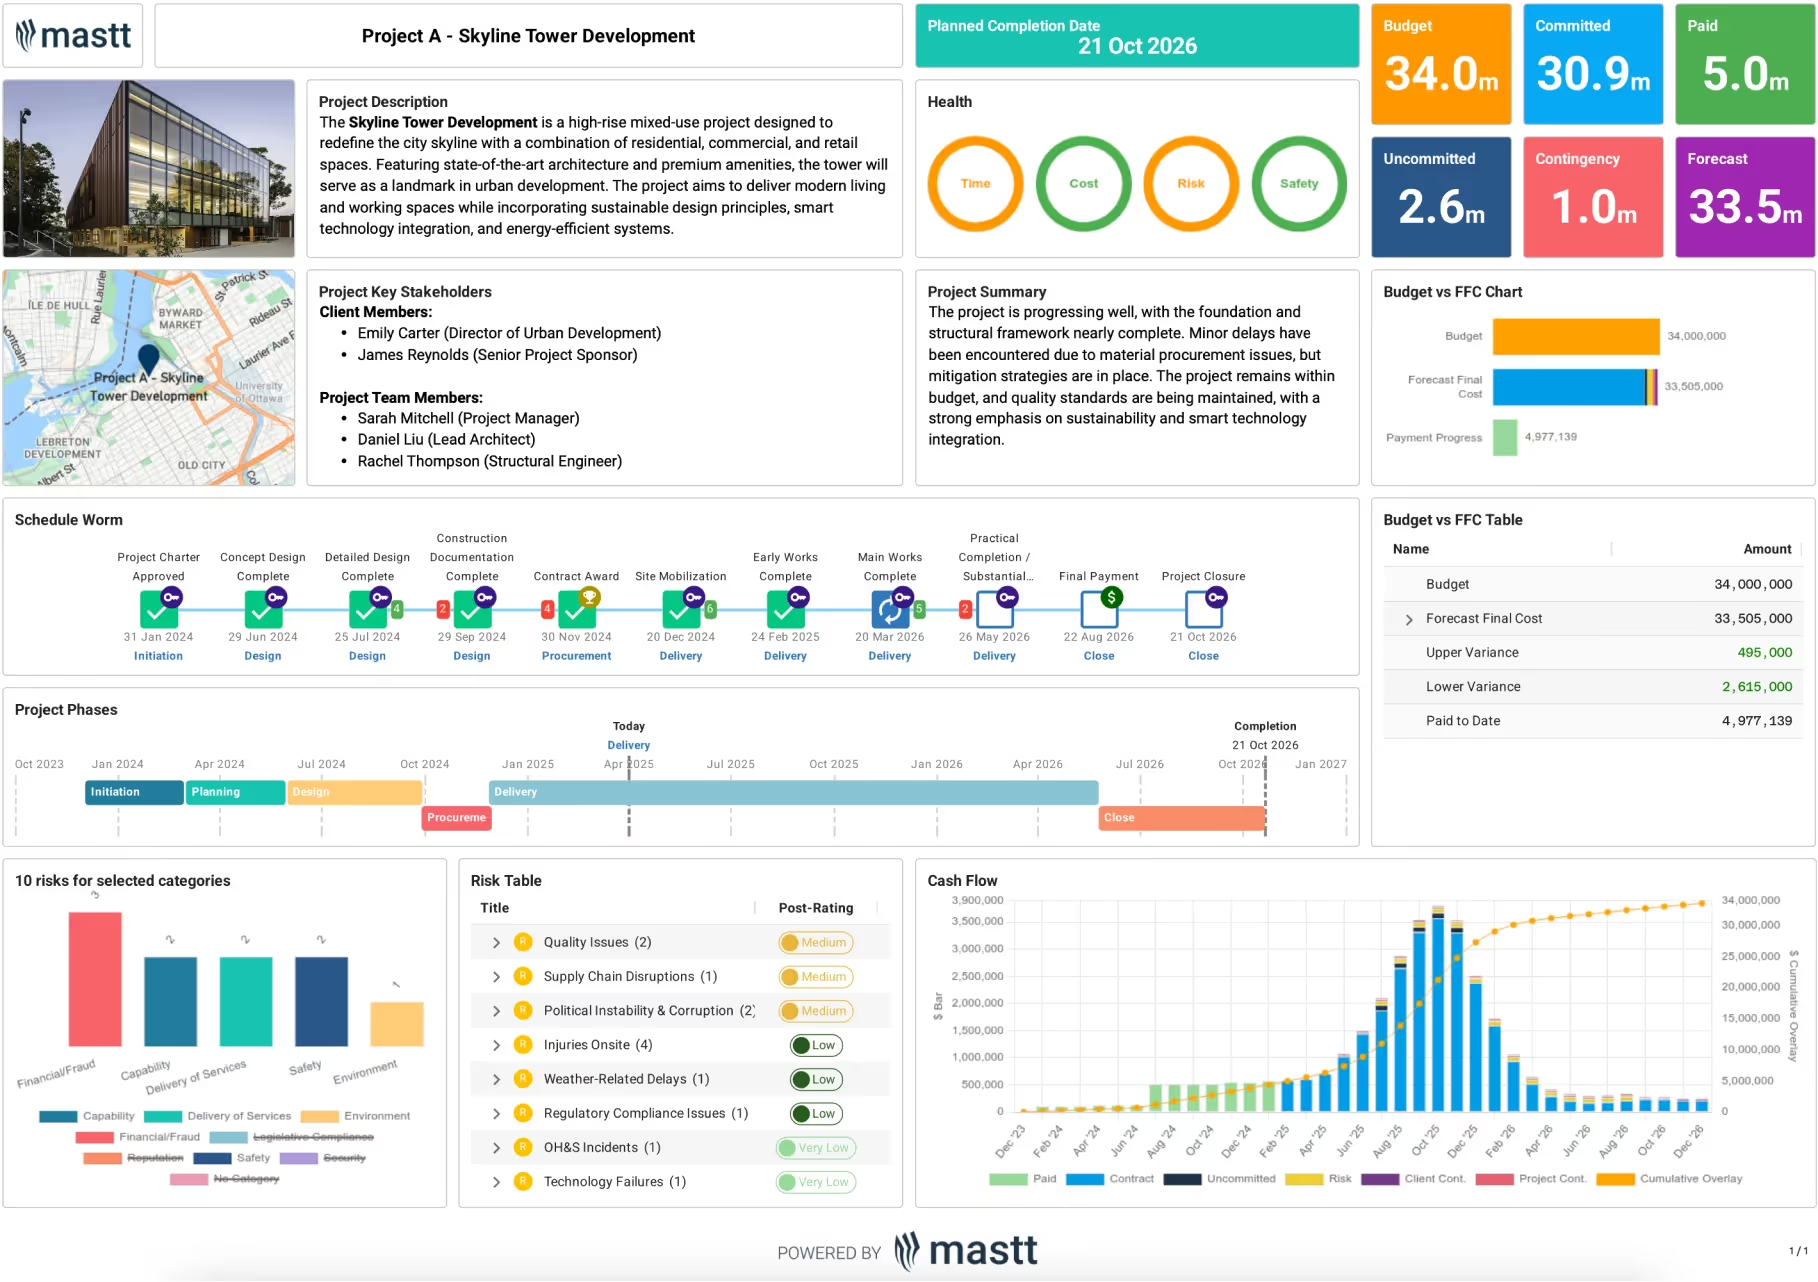
A construction progress report is a structured document that tracks a project's status, completed work, ongoing tasks, delays, risks, and financial updates. It provides real-time insights to keep project managers, contractors, and stakeholders informed. These reports help teams stay on schedule, manage budgets, and resolve issues before they escalate.
Unlike static reports, modern construction progress reports use visual dashboards, live data, and interactive elements to improve decision-making and transparency. Whether for daily, weekly, or monthly tracking, they ensure smooth project execution and keep construction teams aligned.
Why You Should Use Construction Progress Reports
A construction progress report helps keep projects on track by providing clear updates on work done, issues, and next steps. Without it, teams risk confusion, missed deadlines, and budget problems.
These reports matter because they help teams stay organized and make better decisions. Here’s why:
- Keeps everyone informed: Ensures all stakeholders know the project's status.
- Tracks work progress: Shows what’s done, what’s in progress, and what’s next.
- Prevents delays: Identifies issues early so teams can fix them fast.
- Controls costs: Monitors spending and helps avoid budget overruns.
- Improves accountability: Documents responsibilities and completed tasks.
- Manages risks: Flags potential problems before they affect the project.
- Supports better planning: Provides real-time insights for scheduling and decision-making.
Without regular project progress reports, construction teams rely on guesswork. These reports provide the facts needed to finish projects on time, within budget, and without unnecessary setbacks.

How to Create a Construction Progress Report
A construction progress report must be clear, structured, and actionable. It should provide accurate updates, highlight issues, and help teams make informed decisions. Follow these steps to create a report that keeps your project on track.
Step 1: Define the Purpose of the Report
Before writing, determine why the report is needed and who will read it. The content and level of detail will vary based on the audience:
- Clients & Owners: Focus on milestones, budgets, and high-level progress.
- Project Managers & Contractors: Include task updates, risks, and workforce performance.
- Investors & Lenders: Highlight financial status, costs, and funding requirements.
- Regulators & Inspectors: Ensure compliance with safety and construction standards.
Step 2: Choose the Reporting Frequency
Decide how often reports should be created. The frequency depends on project size, complexity, and stakeholder needs:
- Daily Reports: Short updates on site activities, worker attendance, and incidents.
- Weekly Reports: Summarize completed work, upcoming tasks, and minor issues.
- Monthly Reports: Provide detailed project overviews, financial updates, and major risks.
Step 3: Gather Accurate Data
A construction progress report relies on up-to-date information. Collect data from reliable sources, including:
- Site logs and daily reports: Document work completed and any delays.
- Project schedules and Gantt charts: Track task completion and upcoming deadlines.
- Financial records: Compare actual costs to the project budget.
- Risk and safety reports: Identify hazards, incidents, and compliance issues.
- Photos and visual evidence: Provide clear proof of progress.
Step 4: Use a Clear and Organized Format
A well-structured report makes it easier to understand. Here’s a basic format to follow:
- Project Overview: Name, location, timeline, and current status.
- Work Completed: Summary of tasks finished since the last report.
- Ongoing & Upcoming Work: List of in-progress tasks and what’s next.
- Schedule Updates: Timeline changes, delays, or early completions.
- Budget & Financials: Cost updates, spending trends, and forecasts.
- Risks & Issues: Problems affecting progress and mitigation strategies.
- Safety & Compliance: Incident reports and safety measures.
- Stakeholder Decisions: Approvals, changes, or required actions.
- Visuals & Supporting Data: Photos, charts, and key metrics for clarity.
Step 5: Keep the Report Concise and Actionable
Avoid unnecessary details. Focus on key insights that help teams make decisions. Use bullet points, tables, and charts to present data clearly. Every section should answer what has happened, what’s next, and any required actions.
Step 6: Use Digital Tools for Efficiency
Instead of creating reports manually, use construction reporting software like Mastt or dashboards to automate updates. These tools allow:
- Real-time data access for accurate reporting.
- Interactive charts and visuals to enhance clarity.
- Easy sharing with stakeholders via links or digital reports.
Step 7: Review and Distribute the Report
Before sending the report, double-check accuracy and completeness. Ensure:
- Data is correct and up to date.
- Charts and visuals support the key points.
- The report is easy to read and understand.
Once finalized, share the construction progress report with the right stakeholders through email, cloud platforms, or project management tools.
Did You Know: Manually creating reports can be time-consuming and prone to errors.
Mastt simplifies the process with automated reporting tools, real-time data tracking, and interactive dashboards. Instead of juggling spreadsheets, project managers can generate clear, professional reports in minutes—all with live project insights that update instantly.
With Mastt, construction teams can track progress, monitor budgets, and flag risks in one central platform, making reporting faster, more accurate, and hassle-free.
Who Needs a Construction Progress Report?
Anyone involved in a construction project needs a construction progress report to track work, avoid delays, and stay updated. These reports help teams stay organized and make better decisions.
Here’s who needs them:
Your report's audience can shape its content and style. A report for a client may differ from one for your team or a board member. So, consider what each audience member needs to know when preparing a progress report. Then, tailor your report to meet those needs.
Start by identifying your audience's specific needs and expectations.
Ask yourself: What are their main concerns? Do they care more about budget updates, timelines, or risk management? Consider what key metrics and data points will benefit them most.
For example, a site manager may prioritize daily task updates, while a client may want a broader, high-level overview.
Also, think about how the report can provide actionable insights. How can the data presented help your audience make informed decisions?
Lastly, choose a format that will make the report easiest for your audience to understand. Should you include more visuals or data tables? Or will a short, concise narrative be more effective?


When Do You Need a Construction Progress Report?
A construction progress report is needed at specific times to track work, avoid delays, and keep projects on schedule. The timing depends on project size, complexity, and reporting needs.
Here’s when you need one:
- Daily: When tracking site work, worker activity, and safety updates.
- Weekly: When reviewing completed tasks, upcoming work, and minor delays.
- Monthly: When checking overall progress, budget status, and long-term risks.
- Before major milestones: When confirming key tasks are done before moving forward.
- During project issues: When documenting delays, cost overruns, or unexpected problems.
- Before stakeholder meetings: When updating owners, investors, or regulators on progress.

Overcoming Common Construction Progress Reporting Challenges
With so much information, regularly preparing construction progress reports can become time-consuming for a project manager. The key challenges we see (and some solutions) are in:
1. Gathering Data is Hard
One common issue is gathering accurate data. Implement a reliable data collection system or use a reporting platform to address this. This ensures you have timely and accurate information when it’s needed most.
2. Preparing Charts, Tables & Visualizations is Time-Consuming
Another challenge is presenting data clearly and concisely. Many project managers need more time and expertise to create complex visualizations and reports using tools like Excel or PowerBI.
To address this, consider utilizing a dedicated reporting platform like Mastt, which streamlines data presentation through automated dashboards and pre-configured report outputs, making the process faster and more efficient.
3. Setting up Takes Time
Instead of starting from scratch, consider using templates or pre-configured software solutions to streamline the process and save time.
- Project Report Template: Get a free Project Report Template or Project Dashboard Template and tailor it to your needs. These templates include sections for project status, costs, risks, and key milestones.
- Construction Cost Tracker: Construction cost tracking requires managing commitments and expenses using a Capital Project Cost Tracker in Excel or cost tracking software for construction. Regularly update forecasts to reflect any changes.
- Risk Register: List potential risks in a Project Risk Register Template or Risk Register Software, assess their impact, and plan how to handle them.

4. Comparing What’s Changed between Reports
Generating construction progress reports demands meticulous data collection throughout the project. Timely and consistent data gathering is crucial, especially when tracking changes between reporting periods.
However, this process can be challenging when manually compiling extensive spreadsheet data and analyzing specific dates for changes. The complexity often leads to errors and inefficiencies.
To enhance accuracy and simplify the process, it's advisable to use a dedicated reporting platform that automates outputs, streamlines workflows, and reduces manual effort.

Leveraging Technology for Progress Reporting in Construction
Technology can be a game-changer for progress reporting. Digital tools and software can automate data collection and report generation.
These tools can also provide real-time updates. This allows for quicker decision-making and problem-solving.
Moreover, digital reports are easy to share. Stakeholders can access them anytime, anywhere.
In short, technology can make construction progress reporting more efficient and effective. In the end, a well-crafted construction progress report can be your ticket to a successful project. So, make them count!
.avif)
Written by
Jamie Cerexhe
Jamie Cerexhe is the Chief Technology Officer at Mastt and has a wealth of experience in software development and project management. As a dedicated problem-solver, Jamie has been pivotal in delivering innovative solutions that meet business needs and enhance user experiences. His goal is to continue leveraging technology to drive progress and create value. Outside of work, Jamie enjoys exploring new tools and trends in the tech world, always staying ahead of the curve.


Contributions by
Progress Report Template
Use this FREE progress report template to track project milestones, work completed, and schedule status. Download formats in Word and Excel that keep owners, contractors, and stakeholders aligned on delivery progress.

Walk Into Every Meeting With Confidence, Clarity, and Control
No one wants to look unprepared, blindsided, or uncertain in front of stakeholders — but that’s exactly what happens without Mastt.
Start for FreeTrusted by the bold, the brave, and the brilliant across governments, Fortune 500s, and the world’s best in delivering the future


