


What is a Milestone Chart in Project Management?
A milestone chart is a visual timeline showing only a project's key events: approvals, phase completions, inspections and handover. It marks moments rather than durations, so a reader sees where the project stands without reading the schedule.
That is what separates it from a Gantt chart, which shows every task, its duration and its dependencies. A milestone chart strips that back to the dates a sponsor or board actually asks about.
On a capital project, those are the gates rather than the work: business case approved, design team appointed, entitlements granted, construction contract executed, notice to proceed, structure complete, substantial completion, certificate of occupancy, handover. An owner's team tracks the moments where money is committed or control changes hands.
Milestone Chart Example
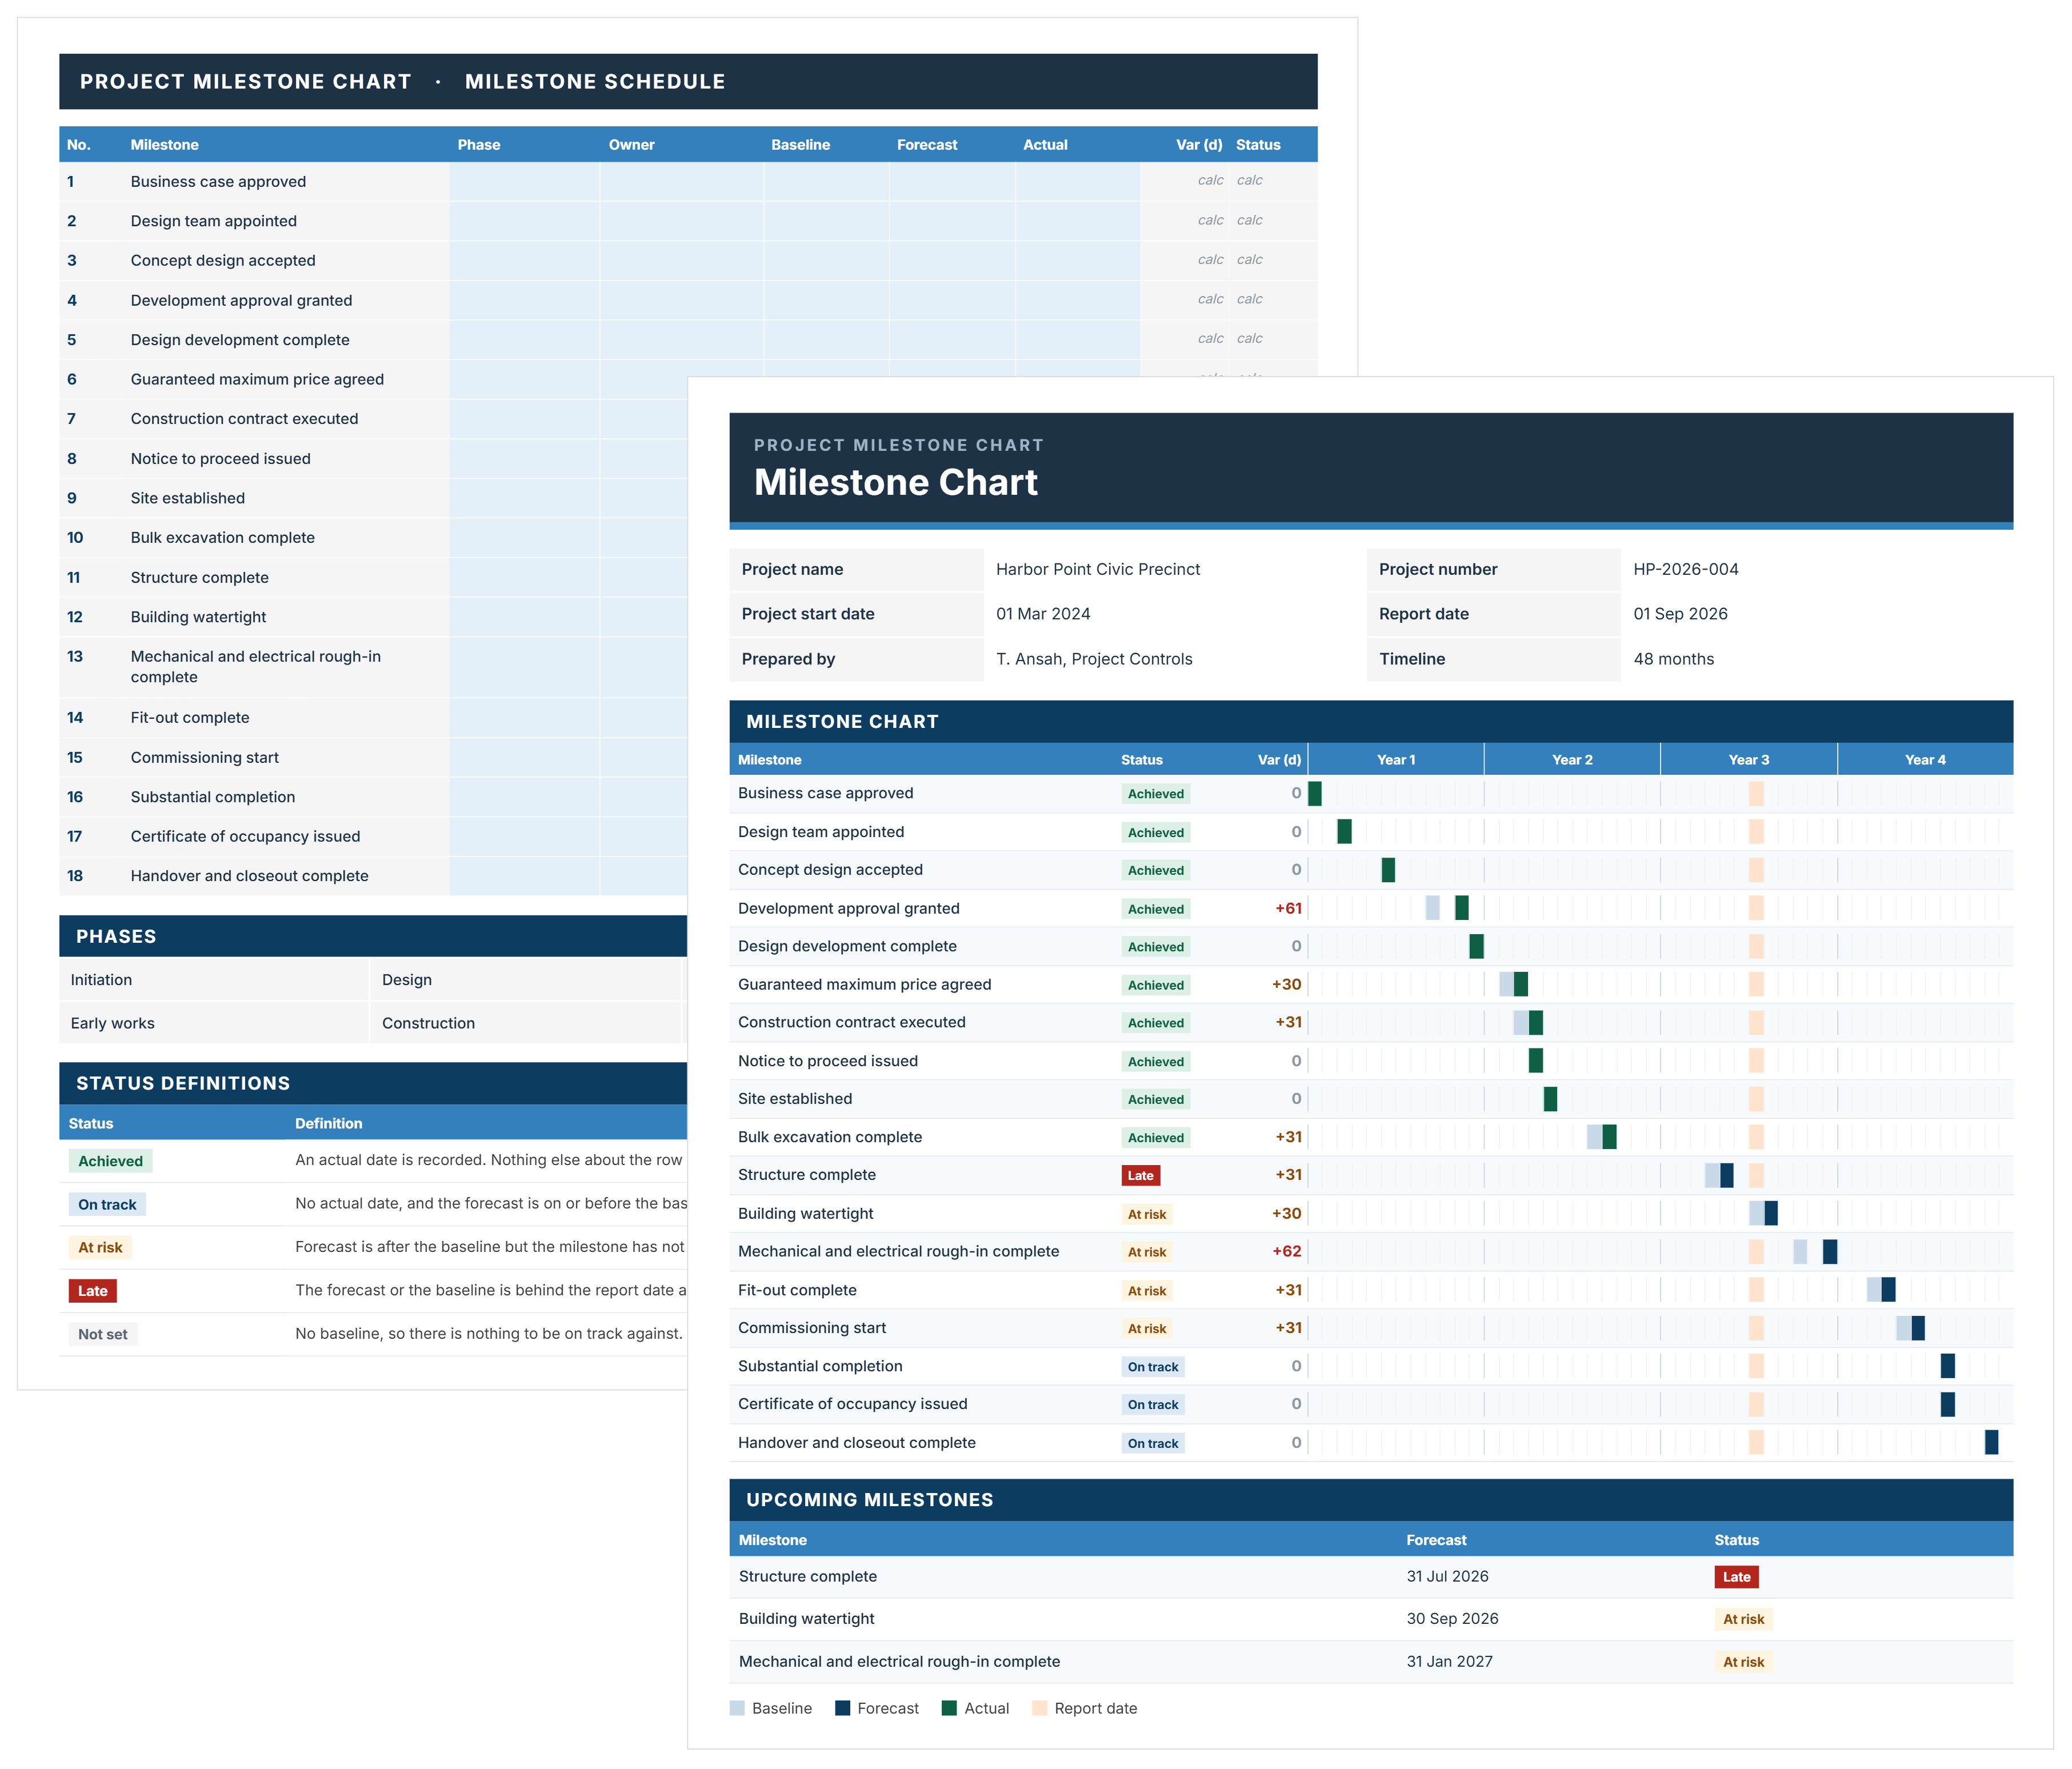
Here's an example of a project milestone chart in Excel format, showing all 18 milestones with baseline against forecast, the variance in days, and the upcoming milestones with a reason against each.

What to Include in a Milestone Chart Excel Template
A milestone chart template needs one row per milestone with three dates against it: the baseline, the current forecast, and the actual once it happens. Everything else is derived.
- Milestone: The event, named as a completed state. "Structure complete," not "build structure."
- Phase: Which stage of the project it belongs to, so the chart groups.
- Owner: The person accountable for the date, not the person doing the work.
- Baseline date: The date agreed at approval. It does not move.
- Forecast date: The date currently expected.
- Actual date: Filled only when the milestone is genuinely achieved.
- Variance in days: Forecast or actual against baseline. The number that gets reported.
- Status: Achieved, on track, at risk, late, or not set.
This free Excel template carries all of it across seven sheets, with 18 worked milestones already filled in.
Every status word has a stated test, applied in order. Achieved means an actual date is recorded. On track means no actual date and a forecast on or before baseline.
At risk means the forecast is past baseline but the milestone has not passed the report date. Late means the forecast or baseline is behind the report date. Not set means there is no baseline, so there is nothing to be on track against.
How to Create a Milestone Chart in Excel Using This Template
To create a milestone chart in Excel, start with the report date on the Cover sheet. Every status on the Milestones sheet is calculated against it, so a stale report date makes late milestones read as on track.
- Set the project name and report date on the Cover sheet.
- Edit the eight phase names on the Lists sheet to match your project's stages.
- Enter one row per milestone on the Milestones sheet, named as a completed state.
- Assign a phase and a named owner to each.
- Enter the baseline date, agreed at approval, and do not change it afterward.
- Enter the current forecast date. Leave actual empty until the milestone is genuinely achieved.
- Read the variance and status columns rather than typing them.
- Open the Milestone chart sheet for the timeline view, or the Gantt sheet for the same milestones as spans.
- Read the Summary sheet, which calculates from the Milestones table and flags anything behind the report date.
Types of Milestone Charts
The two type of milestone charts are: a timeline-based milestone chart and a Gantt-based milestone chart. This template produces both from the same table.
The timeline version stays deliberately simple. It carries big-picture dates only, which is why it survives being put in front of a board.
A full Gantt chart is a different document again. It maps every task, duration and dependency, and overlays milestone markers on top of that. Use it for planning the work; use a milestone chart for reporting the dates.
Related Articles and Templates
Explore these resources for project milestones, timelines, scheduling, dependencies, and critical path planning:
.avif)
Written by
Doug Vincent
Doug Vincent is the co-founder and CEO of Mastt, the AI capital-project management platform used by governments, Fortune 500 companies, and consultancies across APAC, North America, and MENA. Before founding Mastt in 2019, he spent a decade at RPS delivering more than $2 billion in capital works, including the $2.1B Defence Navy Infrastructure program, and holds a CPSPM certification with the AIPM. He contributes content and speaks on AI in capital project delivery at Mastt.

FREE milestone chart Excel template with 18 worked milestones. Track every key project date against its baseline and see at a glance which milestones have slipped.

Top Performers Don’t Guess. They Deliver.
Cut the stress of showing up unprepared
Start for FreeTrusted by the bold, the brave, and the brilliant to deliver the future