What is an S Curve in Excel?
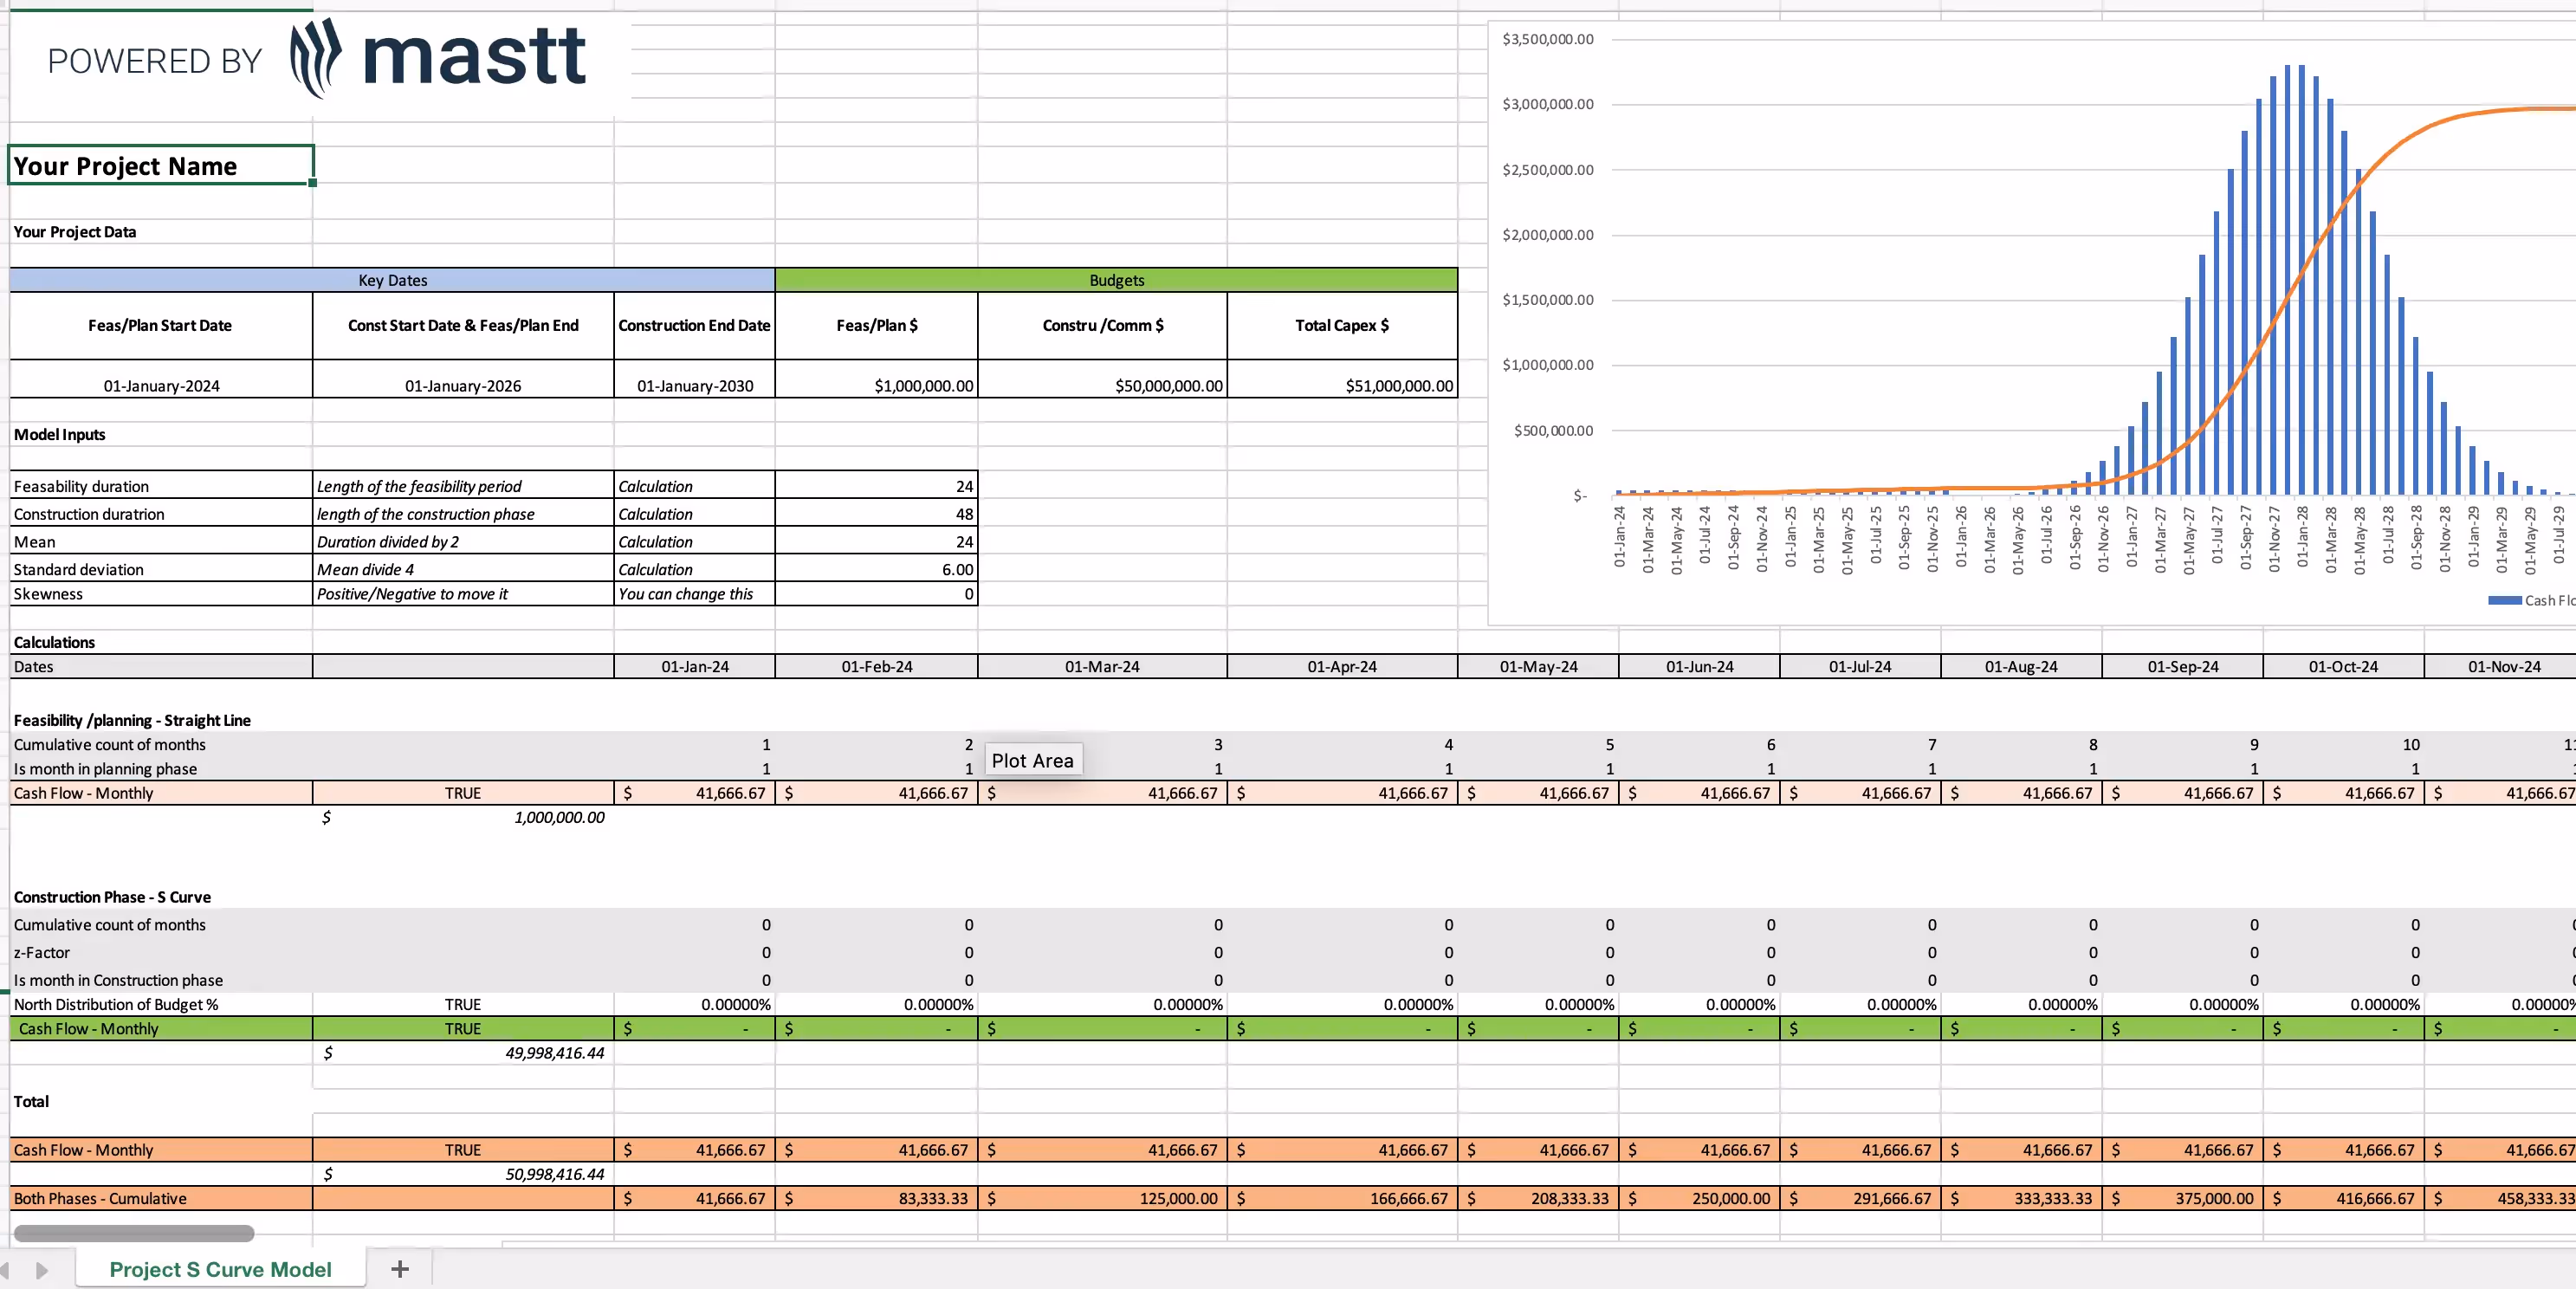
The S Curve in Excel is a vital capital project management tool that graphically represents cash flow or project progress over time to monitor performance, budget, and resource allocation. It is essential for communicating with project stakeholders, such as general contractors, client-side project managers, project consultants, and project sponsors, offering a visual insight into the pace and trajectory of project spend, milestones, and financial health.
Rather than having to learn advanced spreadsheet formulas or logistic and cumulative distribution functions, you can use this S Curve Excel Template we’ve created for free.
Why You Need an S Curve Template
The S Curve template is an essential project management tool that offers:
- Clear Monitoring: Track project progress and resource allocation visually, offering a concise overview of performance.
- Informed Decision-Making: Utilize accurate data to determine whether a project is on track, ahead, or behind schedule.
- Effective Stakeholder Communication: Share easy-to-understand visuals to keep everyone aligned and informed.
- Proactive Risk Management: Detect deviations early, implement corrective actions, and mitigate risks like miscommunication, delays, or budget overruns.
- Future Planning: Forecast trends and make adjustments to timelines, resources, or budgets based on clear insights.
- Streamlined Calculations: Simplify complex tasks with pre-built formulas for consistent and reliable reporting.

How to Use an S Curve Excel Template
This free S Curve Excel Template is designed to help you monitor project performance in a visual format.
Here’s how to use it effectively:
1. Download & Customize
Start by downloading the template and tailoring it to meet your project’s specific requirements. Adjust the layout, input relevant data, and customize labels as needed. Include essential details such as project name, budget allocation, and work hours to create a solid foundation.
2. Input Planned Data
Input the planned data for your project, such as budgeted costs, expected work completion, and resource allocation. This step establishes the "planned" S Curve, representing your project’s baseline.
3. Input Actual Data
Regularly update the template with actual data as the project progresses, including incurred costs, hours worked, and percentages of work completed. This forms the "actual" S Curve for comparison against the baseline.
4. Generate the S Curve
Use the built-in formulas and graphs in the template to create the S Curve. This visual representation highlights project progress compared to the original plan and helps identify any deviations or delays.
5. Analyze Progress
Examine the S Curve to assess project performance. Steep upward slopes indicate rapid progress, while flatter curves suggest delays or slower momentum. Compare the planned and actual curves to determine whether the project is on track, ahead, or behind schedule.
6. Track Budget & Resource Utilization
Leverage the S Curve to monitor planned versus actual budget and resource utilization. Identify deviations early, such as overspending or mismanagement, and address them before they escalate.
7. Forecast Future Performance
Based on the shape of the S Curve and actual progress, forecast how the project is likely to proceed. Use these insights to proactively adjust resource planning, budgets, or schedules as needed.
8. Review and Share
Keep the S Curve accurate by regularly updating it with fresh data. Share the updated curve with stakeholders to maintain transparency, ensure alignment, and address any areas requiring attention.
When to Use an S Curve Template
The S Curve template is a versatile tool that provides valuable insights at every stage of a construction project.
- During Project Planning: To set baselines for project budget and schedule.
- In Execution: To monitor deviations and ensure adherence to plans.
- At the End of a Project: For performance analysis and reporting.
By using the S Curve template throughout the project lifecycle, you can ensure accurate tracking, effective communication, and data-driven decision-making.
Common Issues and Solutions
While the S Curve template is highly effective, challenges may arise if not used correctly.
- Inconsistent Data Entry: Ensure uniform formatting and double-check all inputs.
- Misinterpreting Curves: Provide training or documentation to help stakeholders understand the S Curve.
- Neglecting Updates: Schedule regular updates to keep the S Curve accurate and actionable.
Addressing these issues ensures the S Curve remains a reliable and impactful tool for managing construction projects effectively.
Free S Curve In Excel Download
If you're looking to streamline and automate the generation of your project cash flow, this download includes:
- 1 x S Curve in Excel file.
This free construction project cash flow template available for download by filling in the form at the top of this page, ready for you to customize and utilize for more effective project cash flow tracking, project cost management, and performance management.

Using S Curve with Mastt
Follow these steps:
- Template Calculations: Use the free S Curve template to calculate cash flow values based on project duration and cost components.
- Input into Mastt: Copy the calculated values from the template and paste them into the Cash Flow component of Mastt’s Cost module.
- Automated Reporting: Mastt automates cash flow reporting, allowing you to compare target, baseline, and actual values at the project level.
- Program-Level Aggregation: Data from individual projects is aggregated to the program level within Mastt for elevated cash flow analysis and insights.

Take Your S Curve Further
As powerful as the S Curve Excel Template is for tracking project performance, it can be even more effective when paired with advanced project management tools. By integrating the insights from your template with Mastt, you can take your project tracking and reporting to the next level.
Mastt enhances the usability of your S Curve data with features designed to streamline workflows, automate processes, and provide deeper analysis.
- Budget-Level Cash Flow Form: Allows direct input from Excel for streamlined workflows.
- Toggle Forecasts: Switch between forecasted and paid cash flows for comprehensive tracking.
- Customizable Dashboards: Generate tailored reports for detailed performance analysis.
With Mastt, you not only simplify project management tasks but also unlock new levels of accuracy and efficiency, ensuring your project stays on track from start to finish.

Written by
Jackson Row
Jackson Row is the Growth & North American Market Lead at Mastt. With a background in risk modeling, cost forecasting, and integrated project delivery, he helps capital project owners work smarter and faster. Jackson’s work supports better tools, better data, and better outcomes across the construction industry.

Download the FREE S Curve Excel template to track progress, manage costs, and monitor performance in construction projects.

Top Performers Don’t Guess. They Deliver.
Cut the stress of showing up unprepared
Start for FreeTrusted by the bold, the brave, and the brilliant to deliver the future