


What is a WBS Diagram Template?
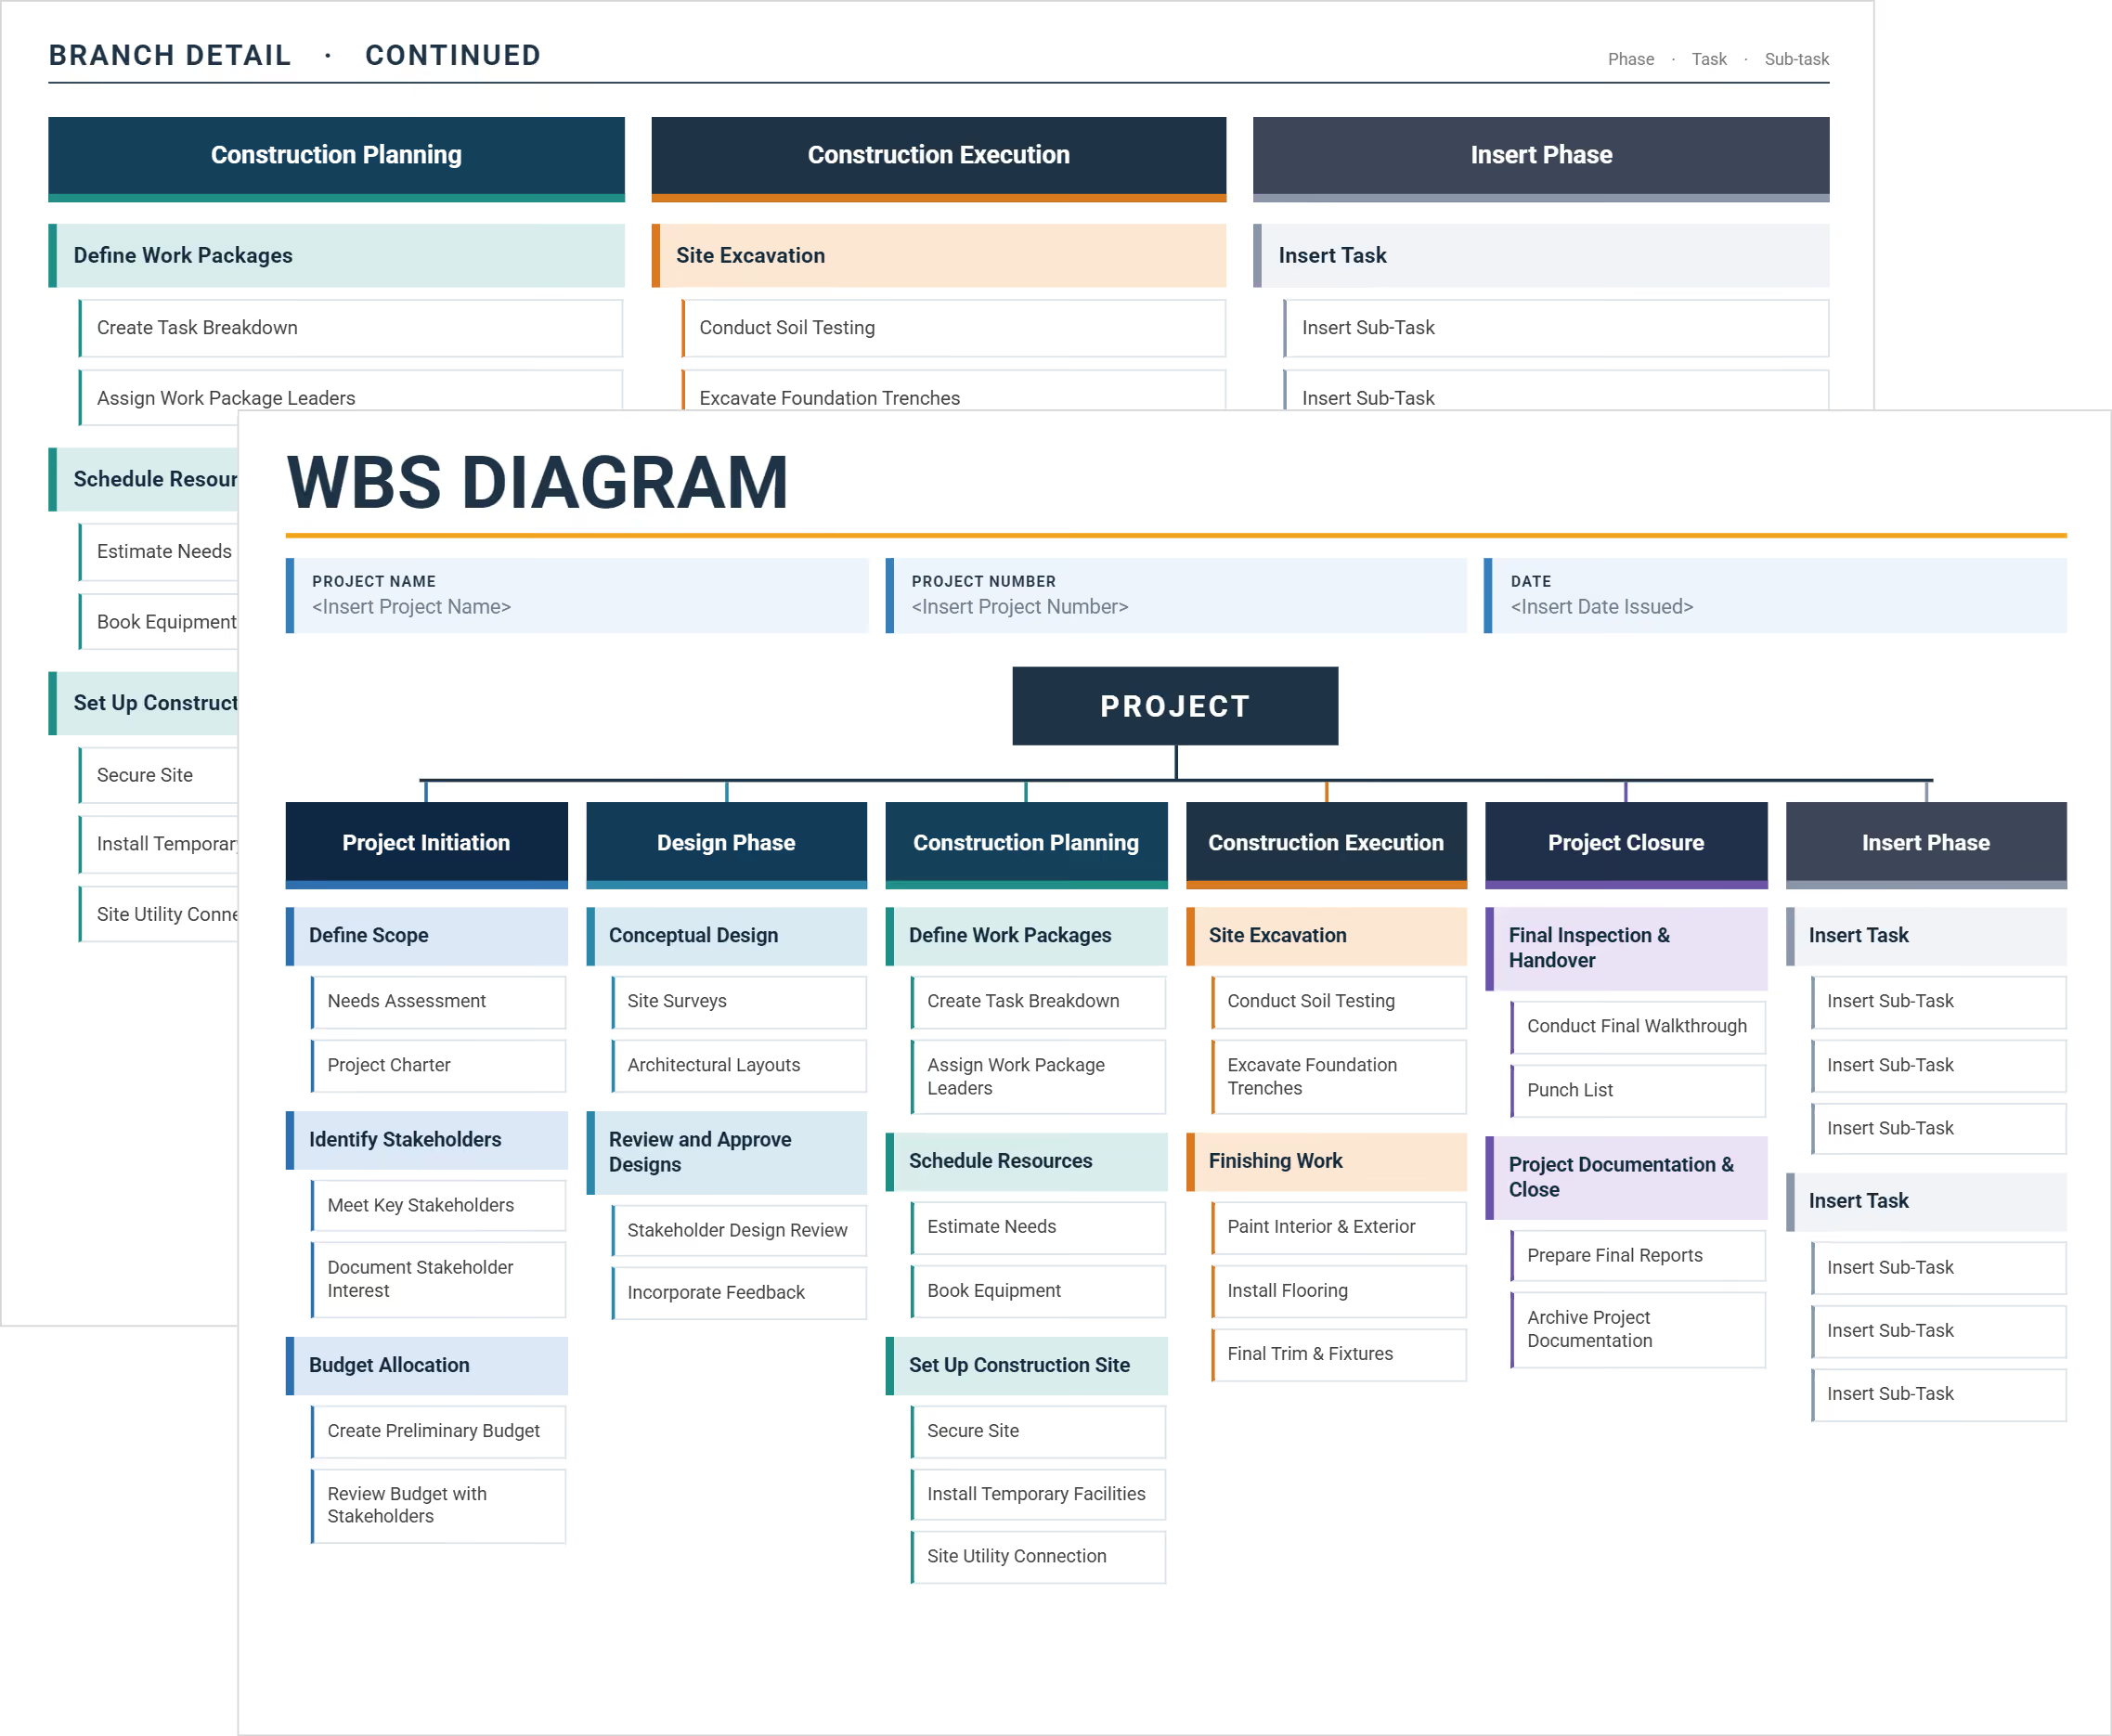
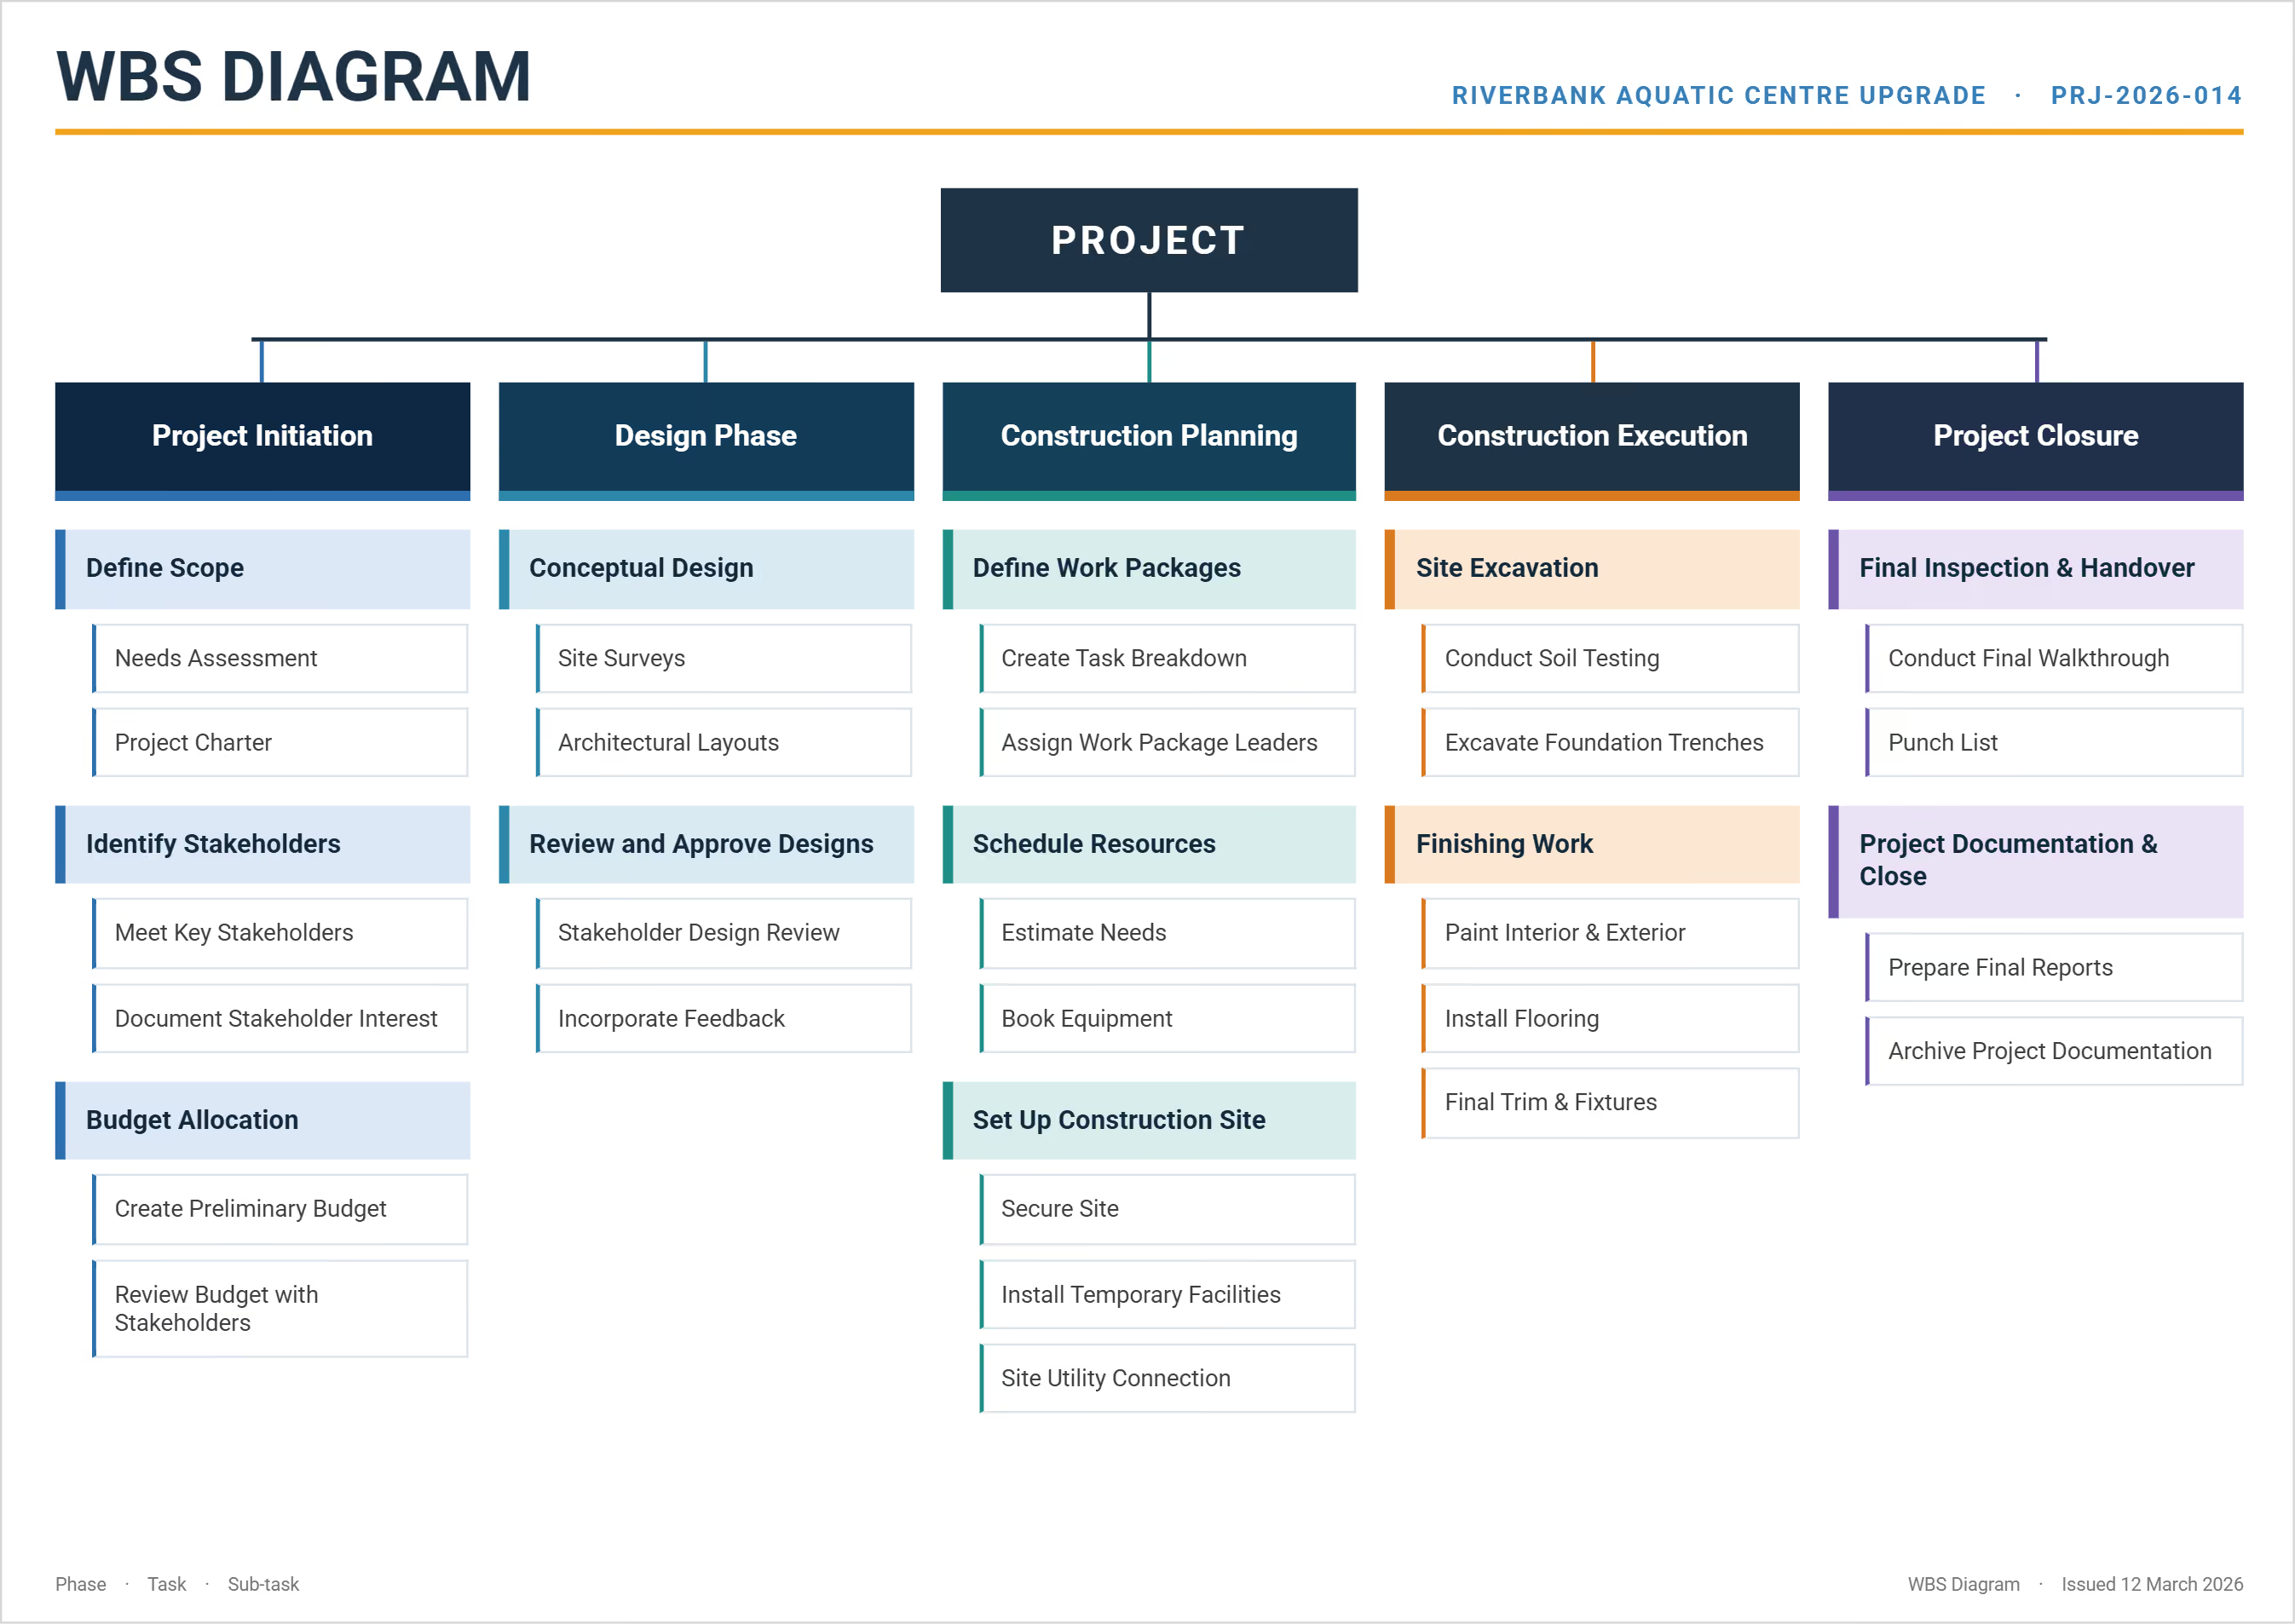
A WBS diagram template is a pre-formatted visual tool that displays project scope as a hierarchical tree structure. It provides ready-made layouts showing how complex deliverables break down into smaller, manageable components called work packages.
WBS diagram templates have boxes or nodes connected by lines to show parent-child relationships between project elements. Each level represents increasing detail, from the overall project at the top to specific tasks at the bottom.
Project teams download WBS tree diagram templates in Word, PowerPoint, or Excel formats for quick customization. The visual format helps stakeholders understand scope boundaries and deliverable relationships during presentations and planning sessions.
What's Included in Work Breakdown Structure Diagram?
Work breakdown structure diagram contain pre-built visual elements for organizing project scope hierarchically. The template provides formatted shapes, connectors, and layout structures that teams customize with their specific deliverables.
Essential components of a WBS diagram include:
- Top-level project box: The final deliverable or project name positioned at the hierarchy's apex.
- Level indicators: Visual tiers showing decomposition depth, typically three to five levels from project to task.
- Connector lines: Relationship indicators linking parent deliverables to their subordinate work packages clearly.
- Work package boxes: Lowest-level elements representing manageable units assignable to teams or individuals.
- Formatting consistency: Uniform shapes, colors, and spacing ensuring professional appearance across all hierarchy levels.
- Deliverable-oriented labels: Text fields structured for outcome descriptions rather than activity or process names.
- Level formatting guides: Visual cues distinguishing major deliverables from sub-deliverables and individual work packages.
💡 Pro Tip: Color-code your levels before the kickoff meeting. Stakeholders grasp scope faster when visual hierarchy matches organizational responsibility, like blue for client deliverables and green for internal milestones.
How to Use This Free WBS Diagram
Open the WBS Diagram worksheet and replace the project details. Then edit the diagram boxes with your phases, tasks, and sub-tasks.
Start with the main project node, then work down the WBS hierarchy:
- Add project details: Enter the project name, number, and issue date.
- Rename the project: Replace the main “Project” node with your project name.
- Edit project phases: Replace existing phases with your major project stages.
- Add project tasks: Rename task boxes under each relevant project phase.
- Add sub-tasks: Replace existing or placeholder sub-task boxes with detailed activities.
- Use placeholders: Update “Insert Phase,” “Insert Task,” and “Insert Sub-Task” boxes.
- Check the hierarchy: Confirm every task sits under the correct parent activity.
- Review project scope: Validate the WBS diagram with key project stakeholders.
Keep each WBS level focused on clear project scope and deliverables. Update the diagram whenever approved scope changes affect the work breakdown structure.
Why Project Teams Use WBS Tree Diagram
Visual hierarchy WBS diagrams eliminate the confusion that text-based scope documents create during stakeholder presentations. Tree diagrams show relationships instantly, while written lists require readers to mentally construct those connections themselves.
WBS tree diagram accelerate project planning by providing tested visual frameworks instead of blank canvases. Here's why teams choose diagram formats:
- Instant comprehension: Executives grasp project scope in minutes rather than reading through 20-page text documents.
- Stakeholder alignment: Visual formats prevent the misinterpretations that occur when different people read identical written descriptions.
- Scope boundary clarity: Tree structures make inclusions and exclusions obvious, stopping unauthorized work before it starts.
- Presentation readiness: Pre-formatted diagrams export to PowerPoint or PDF without reformatting for board meetings.
- Planning acceleration: Teams populate diagrams in 2-3 hours versus 6-8 hours building diagrams from scratch.
- Deliverable focus: Visual boxes force outcome-oriented thinking instead of the activity descriptions text lists encourage.
- Hierarchy validation: Tree layouts reveal structural problems like orphaned work packages or unbalanced decomposition immediately.
Teams presenting to executives need visual tools that communicate quickly. Diagrams work when detailed documents fail, and WBS tree diagrams support project scheduling integration seamlessly.
When to Use Work Breakdown Structure Diagram
Deploy work breakdown structure diagram during initial planning when stakeholders need shared understanding of scope boundaries. Diagrams prevent misalignment before project budgets get approved or teams mobilize for delivery.
Critical moments requiring WBS diagram development include:
- Project initiation: When executives approve concepts but before detailed planning begins, diagrams formalize scope agreement.
- Proposal development: Before bid submission, visual scope presentations help differentiate your understanding from competitors who submit text.
- Kickoff meetings: At project launch, diagrams align all parties on deliverables, preventing disputes about what was included.
- Scope validation sessions: When ambiguity exists, visual formats force stakeholders to reconcile conflicting interpretations immediately.
- Change control discussions: During scope modifications, diagrams show exactly where new work fits within existing structure.
- Design development: As design progresses, decomposition reveals coordination needs between disciplines and systems.
- Progress reporting: Throughout project delivery, visual formats communicate completion status faster than written updates to busy executives.
💡 Pro Tip: Present the WBS diagram at your first owner meeting, not your third. Early visual alignment prevents the painful scope resets that happen when text documents get interpreted five different ways.
Related Articles and Templates
Explore these WBS resources, planning guides, and scheduling templates for construction projects:
.avif)
Written by
Doug Vincent
Doug Vincent is the co-founder and CEO of Mastt, the AI capital-project management platform used by governments, Fortune 500 companies, and consultancies across APAC, North America, and MENA. Before founding Mastt in 2019, he spent a decade at RPS delivering more than $2 billion in capital works, including the $2.1B Defence Navy Infrastructure program, and holds a CPSPM certification with the AIPM. He contributes content and speaks on AI in capital project delivery at Mastt.

FREE WBS diagram template to visualize project scope and prevent scope creep. Download customizable tree diagrams that break complex deliverables into manageable work packages.

Top Performers Don’t Guess. They Deliver.
Cut the stress of showing up unprepared
Start for FreeTrusted by the bold, the brave, and the brilliant to deliver the future