

In project management, monitoring key project health metrics can be a faster, more concise way of digesting a report. One of the most effective tools for this is the RAG Status system.
In this article, we'll explain RAG Status, why it matters, and what a Project Health Dashboard includes.
We'll examine good dashboard examples, offer tips on using RAG Status in projects, and discuss why a Project Health Dashboard is useful.
What is RAG Status?
RAG Status stands for Red, Amber, and Green. This color-coded system provides a quick visual representation of project health, which is essential for project managers to communicate the current status of projects efficiently.

RAG Status Meaning
The RAG Status system is a straightforward yet powerful tool used in RAG project management to convey the health of a project. Each color in the RAG Status system carries a specific meaning that should be specific to you. For example:
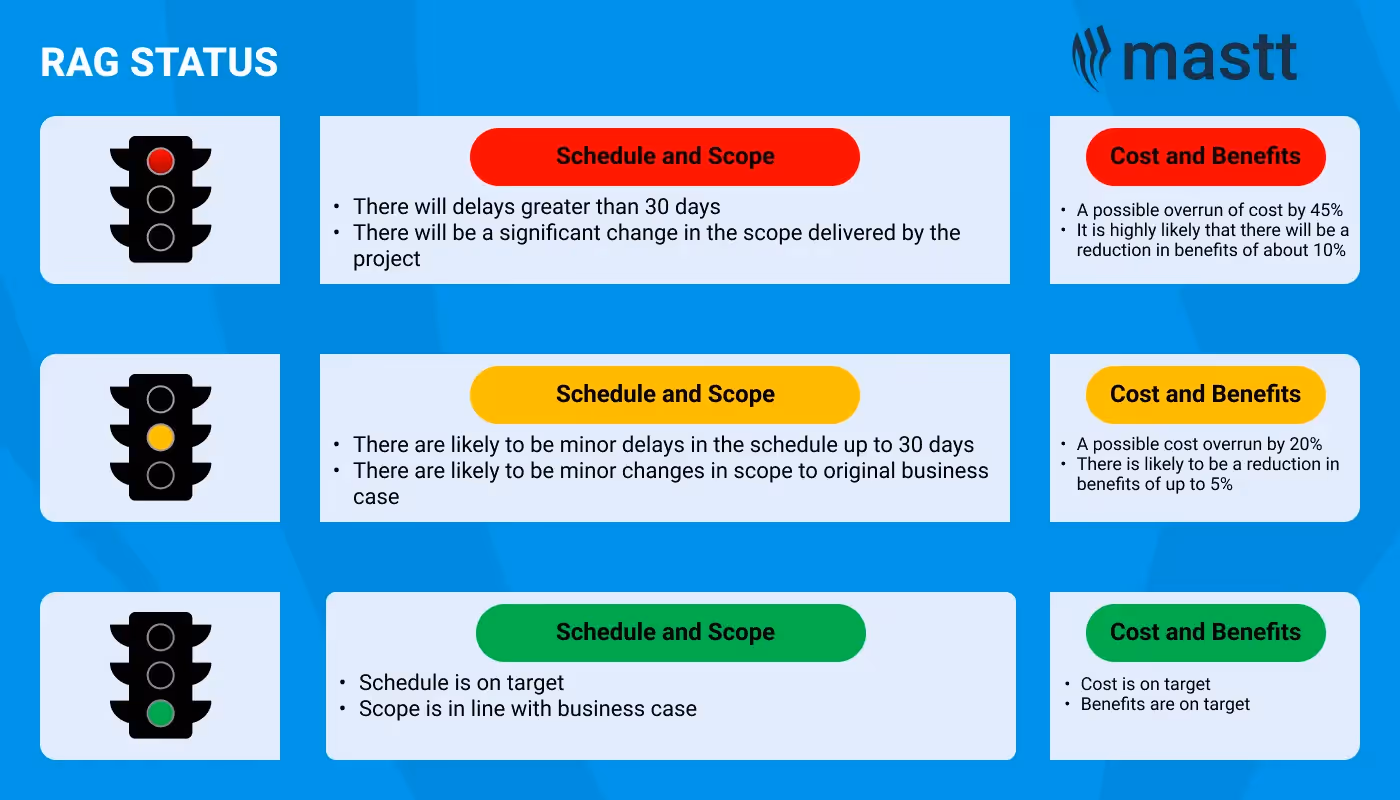
- Red: Indicates critical issues within the project that need immediate attention.
- Example 1: If a project's cost is much higher than planned, e.g., by 10%, it gets a red status.
- Example 2: If the project is very late and important deadlines are missed, it also gets a red status.
- Amber: Signals that the project has some issues that need monitoring but are still manageable.
For example, an amber status might be given if there are moderate cost overruns or schedule delays that are not yet critical but need close attention. This status acts as an early warning system, allowing project managers to take corrective actions before the situation worsens. - Green: Indicates that the project is on track and progressing as planned. If the project is on budget and on time, it will be marked green. This shows stakeholders that everything is going well and the project goals are being met.
In addition to the primary colors, some organizations use additional colors for more nuanced construction reporting:
- Blue: This color indicates completed tasks. For example, once a project phase is finished and all deliverables are met, it can be marked blue to denote its completion.
- Gray: This represents tasks that have not yet started. This helps distinguish between ongoing work and planned activities that have yet to commence.
Importance of RAG Status for Quick Visual Communication of Project Health
The RAG Status system is invaluable for its simplicity and effectiveness in conveying complex information at a glance. A green status means the project is going well. An amber status means there might be some problems that need looking at. A red status means there are big problems that need to be fixed right away.
However, defining what this means to you and your project, program, or portfolio is important.

Components of a Project Health Dashboard
A Project Health Dashboard is a comprehensive tool for project managers to monitor and report on their projects' RAG status. It typically includes several key health metrics.
Key Project Health Metrics to Track
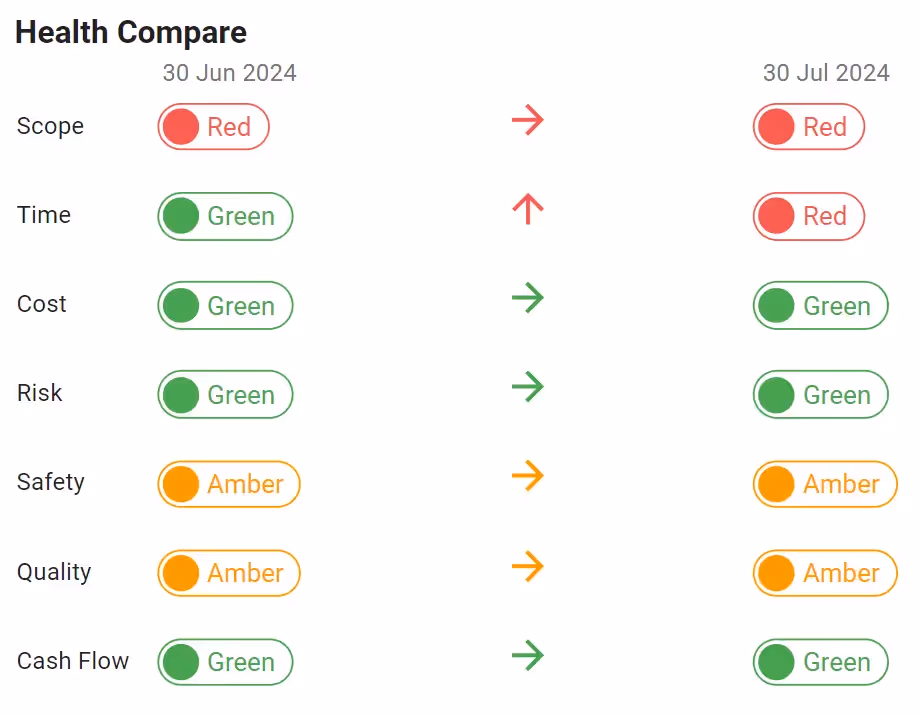
- Scope: This metric measures whether the project is expected to deliver all baseline approved scope. A green status means the project is on track to deliver the full scope. Amber means big changes have been asked for but not approved yet. Red means big changes have happened without a formal process.
- Time: Time tracking assesses the project schedule. A green status signifies the project is on track with less than one month's delay from the approved schedule. Amber indicates a delay of more than one month, and red shows a significant delay of more than six months.
- Cost: This metric measures the project's budget performance. Green means the project is over budget. Amber means it is over budget by 10%. Red means it is over budget by more than 10%.
- Risk: Risk management involves monitoring potential issues that could impact the project. Green status means risks are under control with no big problems. Amber means risks need attention to fix or reduce them. Red means serious risks need immediate action and could cause major problems.
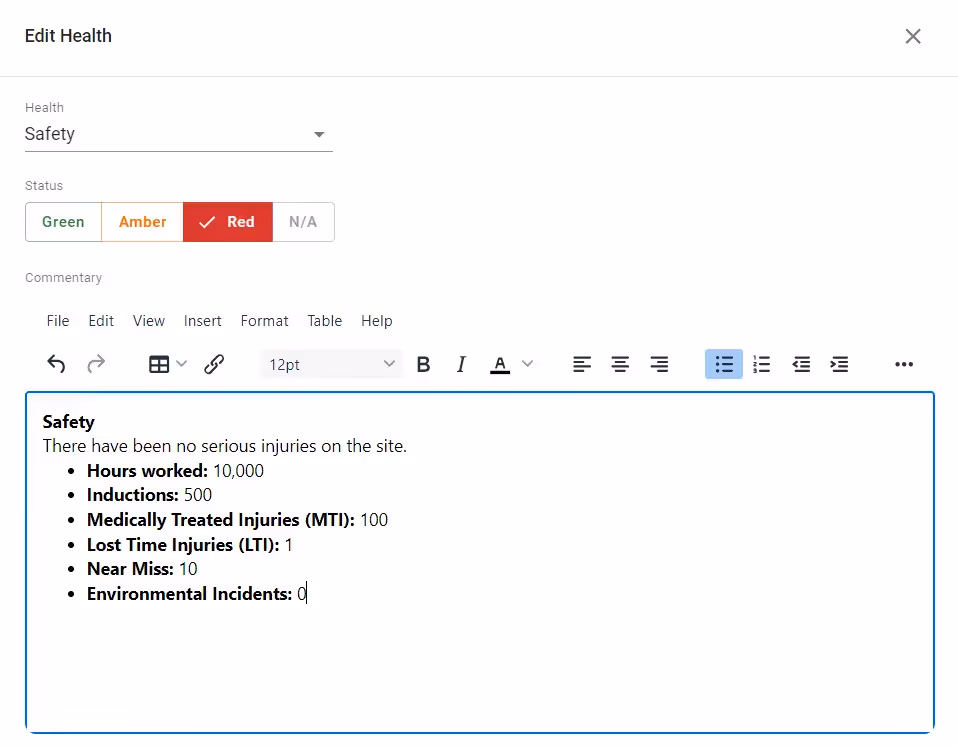
- Safety: Safety metrics track incidents and compliance with safety standards. Green signifies no lost-time injuries (LTI) or notifiable incidents. Amber indicates one LTI or notifiable incident or an Occupational Health and Safety (OHS) inspection by an authority. Red represents two or more LTIs or notifiable incidents.
- Quality: Quality measures ensure the project meets relevant codes and compliance standards. Green indicates no quality concerns and compliance with standards. Amber denotes quality concerns that need resolution, and red signifies major quality concerns and non-conformance to standards.
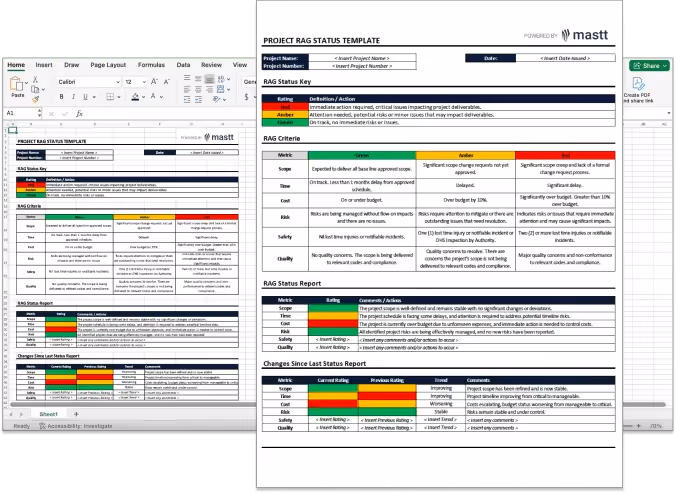
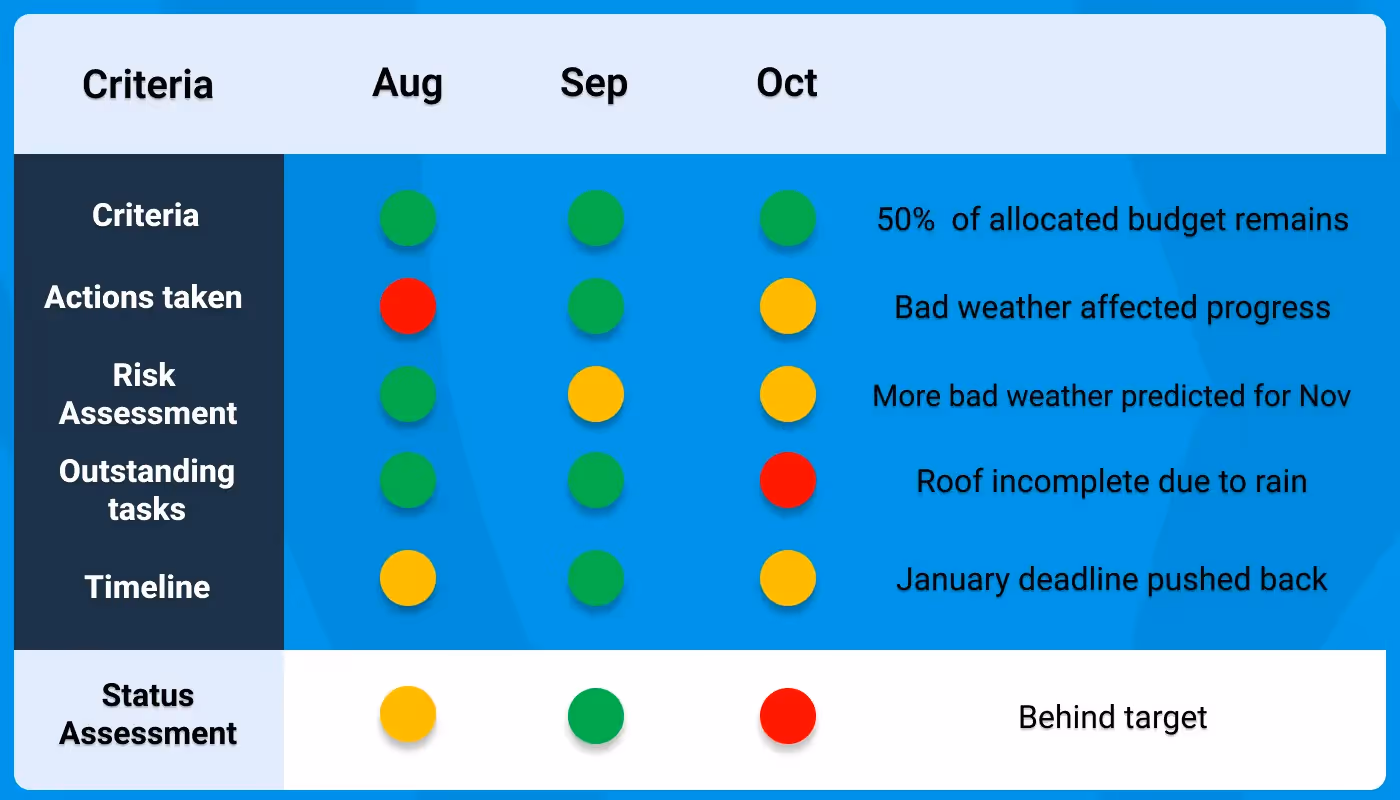
Below is an example of a RAG Status template you can download for free from Mastt.
Importance of Tracking These Metrics for Overall Project Health
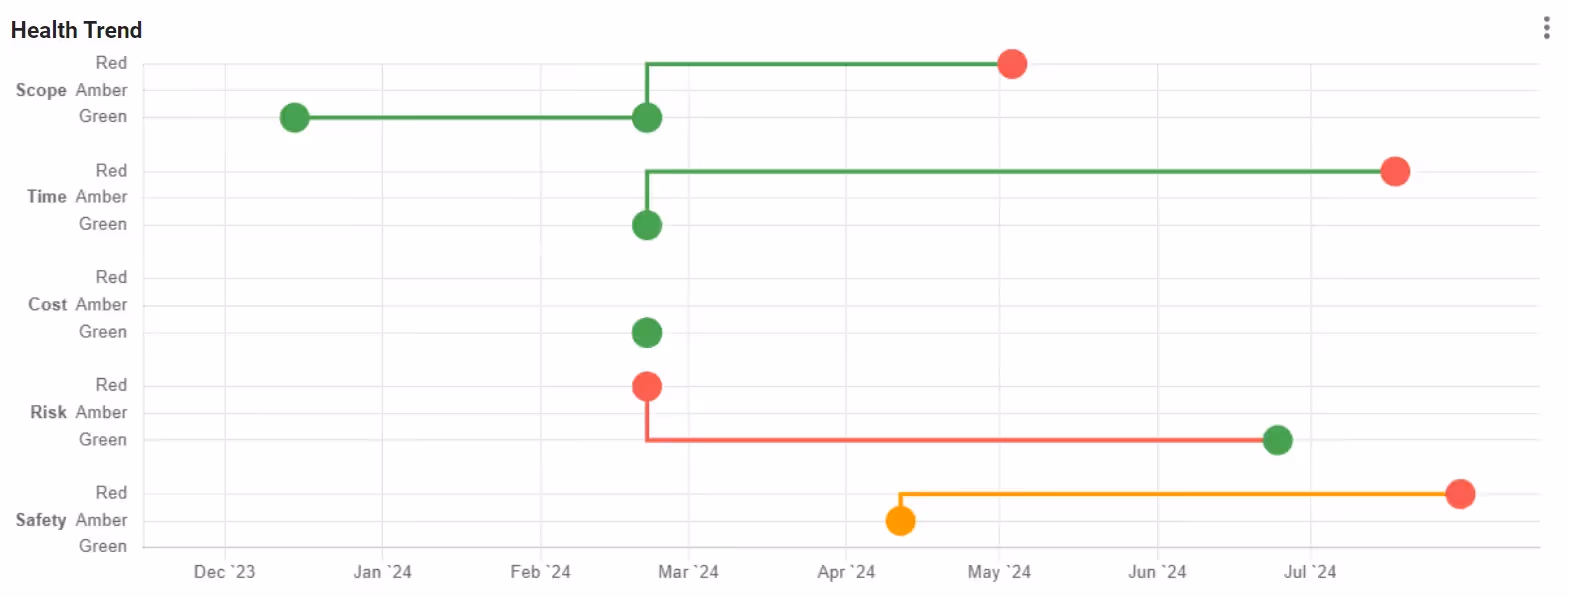
Tracking and reporting these key metrics is crucial for maintaining a comprehensive view of the project's health and will help identify trends, forecast potential issues, and make informed decisions.
Regular monitoring ensures that any deviations from the plan are promptly addressed, maintaining project alignment with its goals up to its project completion.
Providing Context to RAG Status
Providing additional text to accompany an RAG status is crucial for context. While the color codes offer a quick visual cue about the project’s health, they lack the nuance needed to fully understand the underlying issues or successes.
Detailed text-based explanations help stakeholders grasp the specific reasons for status, the potential impact on the project, and the planned corrective actions.
This additional information ensures transparent communication, facilitates better decision-making, and enables more effective project management by providing a comprehensive view of the project's current state.
Creating a Project Health Dashboard
1. Choose the Right Template
There are various project health dashboard templates available that cater to different project needs. Some popular options include:
- Mastt: A fast, easy-to-use software for construction reporting, including RAG Status. Mastt offers advanced features like real-time data integration, customizable views, and detailed reporting tools.
- Smartsheet: A step above Excel and great for straightforward projects, offering easy-to-use templates and real-time collaboration features.
- Excel: It is suitable for basic RAG status reporting and on more than one project. However, it will be challenging to provide a drill-down experience or create detailed and tailored dashboards, as it requires manual setup and maintenance.
- PowerPoint: It is useful for presenting project health summaries in a visually appealing format, making it a good choice if RAG status is used in presentation forums where PowerPoint is already used.

2. Customize Your Dashboard
Customized project dashboard involves:
- Adding Relevant Metrics: Ensure that all key metrics relevant to your project are included.
- Real-Time Data Updates: Incorporate features that allow for real-time data updates to keep the dashboard current.
- Visualization Tools: Use charts, graphs, and other visualization tools to make data interpretation easier.
- User-Friendly Layout: Design the dashboard with a clean and intuitive layout for easy navigation and understanding.
Best Practices for Using RAG Status in Project Management
Setting RAG Status Tolerances
Defining clear tolerances and responsibilities for what constitutes red, amber, or green status is essential. This involves setting thresholds for key metrics:
- Red: Critical thresholds that indicate immediate action is required and needs the attention of executives.
- Amber: Warning thresholds that suggest potential issues that need monitoring but can be addressed by project team members.
- Green: Acceptable ranges that indicate the project is on track.
Consistency in these tolerances ensures that all team members and stakeholders have a common understanding of the project's health.
Responding to RAG Status Indicators
Effective responses to RAG status indicators involve:
- Red Status: Conduct a thorough analysis to identify the root cause of the issue. Implement immediate corrective actions, such as reallocating resources, revising timelines, or adjusting the budget. Regularly review progress to ensure improvements.
- Amber Status: Monitor the situation closely and develop a mitigation plan to prevent it from going red. This might involve additional support, minor adjustments to the project plan, or increased communication with stakeholders.
- Green Status: Maintain current practices and continue monitoring. Celebrate small wins to keep the team motivated and ensure continued progress.
Additional Best Practices
- Incorporate into Meetings: Make the RAG status a central feature of your project team meetings.
- Regular Updates: Update the RAG status and dashboard regularly to reflect the project's current state. Move toward a ‘what’s changed’ style of reporting.
- Transparent Communication: Ensure that all stakeholders are informed about the status and any changes promptly. Consider incorporating it into the dashboard or report for ease of reference.
- Training: Provide team members with training on how to interpret and use the RAG status system effectively. Possibly print out a template and put it on people’s desks.
- Consistent Review Meetings: Hold regular review meetings to discuss the project status, address any issues, and make necessary adjustments.
Benefits of Using a Project Health Dashboard
Faster, Improved Decision Making
Project health dashboards provide a clear and comprehensive view of project performance, aiding in better decision-making in a shorter timeframe. By visualizing key metrics such as cost variance and schedule variance, project managers can quickly identify issues and take corrective actions faster than digesting a whole report.
Enhanced Stakeholder Communication
Clear and concise communication with stakeholders is crucial for project success. Dashboards provide a transparent and easily understandable way to present project updates, ensuring everyone is on the same page. This enhances trust and facilitates better collaboration.
Additional Benefits
- Proactive Issue Resolution: Early identification of issues through RAG status allows for proactive resolution, preventing minor problems from escalating.
- Resource Optimization: Dashboards help in optimizing resource allocation by providing insights into workload and progress.
- Performance Tracking: Continuous tracking of key metrics allows for performance benchmarking and improvement over time.
- Accountability: Dashboards promote accountability by clearly displaying individual and team responsibilities and progress.

Conclusion
RAG Status and Project Health Dashboards are essential tools in project management. They provide a quick and effective way to monitor project health and communicate status to stakeholders.
By tracking important numbers like Cost Variance, Schedule Variance, Earned Value, Planned Value, and Actual Cost, project managers can understand how well their projects are doing.
Using templates from platforms like Mastt, you can customize dashboards to meet your specific project needs. Implementing RAG status allows for immediate identification and resolution of issues, ensuring projects stay on track.
Use project health dashboard templates to improve your project management and achieve better results.

Written by
Jackson Row
Jackson Row is the Growth & North American Market Lead at Mastt. With a background in risk modeling, cost forecasting, and integrated project delivery, he helps capital project owners work smarter and faster. Jackson’s work supports better tools, better data, and better outcomes across the construction industry.


Contributions by

RAG Status Template
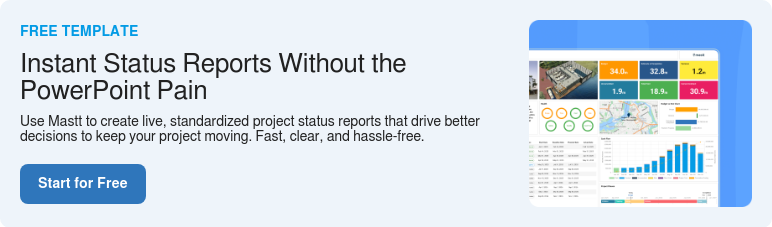
Use this FREE RAG Status Template to give stakeholders instant clarity, highlight risks early, and keep projects on track with clear Red, Amber, Green reports.

Walk Into Every Meeting With Confidence, Clarity, and Control
No one wants to look unprepared, blindsided, or uncertain in front of stakeholders — but that’s exactly what happens without Mastt.
Start for FreeTrusted by the bold, the brave, and the brilliant across governments, Fortune 500s, and the world’s best in delivering the future